Analytics in the Core Platform
Zluri’s Analytics module gives you the flexibility to build powerful visualizations, track access trends, and monitor security and compliance metrics. It consists of three core components: Dashboards, Widgets, and Reports.
Analytics in Zluri follows a layered structure:
Overview → built on → Dashboard → composed of → Widgets → built from → Dataset + Chart
Overview
The Overview is the default landing page when accessing Zluri's IGA or SMP modules. It provides quick, high-level summaries of metrics that matter to you or your organization.
- Can be configured as a Personal Overview, Org Overview, or fallback to Zluri Default Overview
- Powered by dashboards defined at the user or organization level
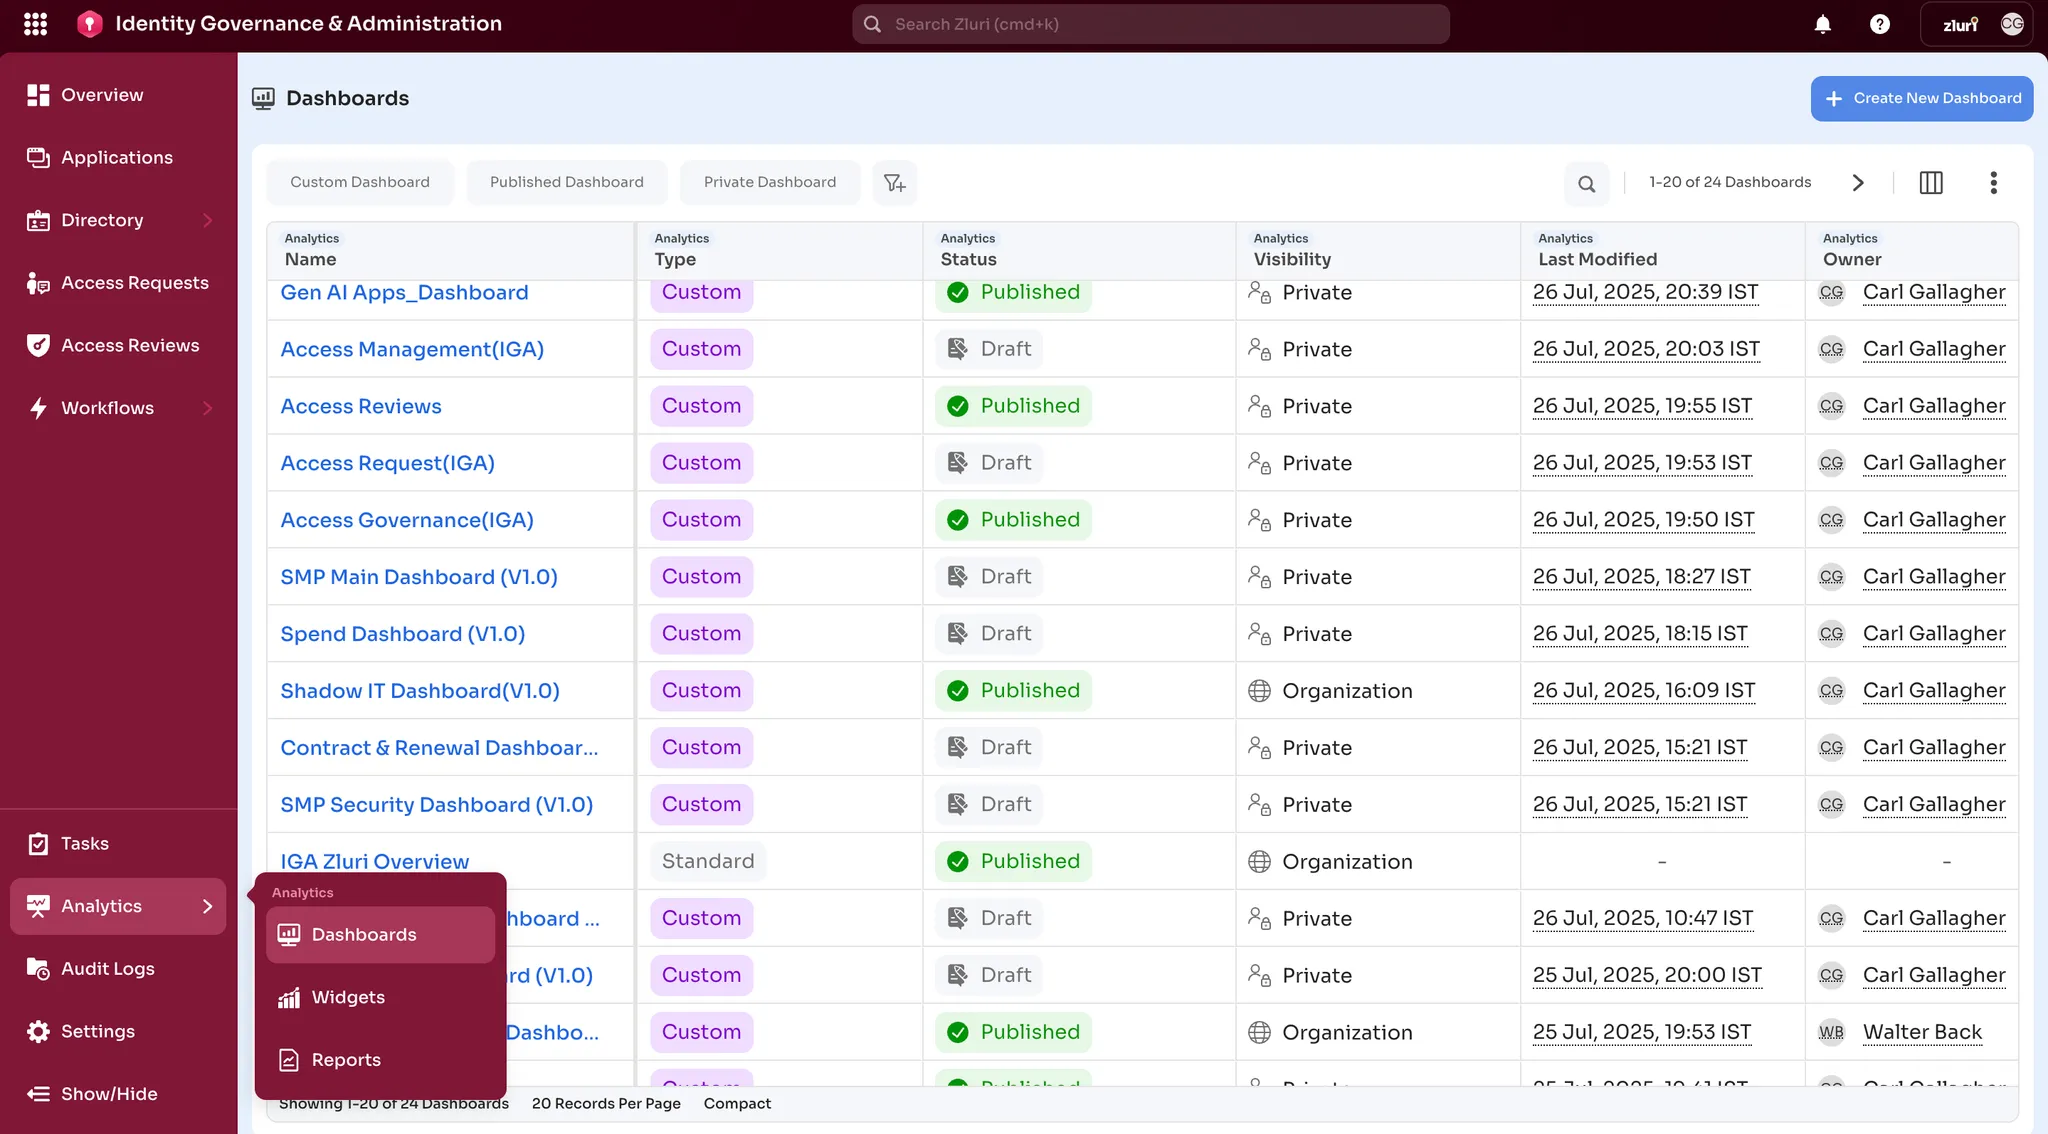
Dashboard
A Dashboard is a customizable collection of widgets designed to deliver visual insights.
- Can be created, shared, and published
- Usable by individuals or teams
- Supports diverse use cases: Access reviews, offboarding progress, app usage metrics, risk scores, etc.
Dataset
A Dataset is a structured data collection tied to specific entities such as:
- Users
- Applications
- Workflows
- Activities
Each Overview page in Zluri (whether SMP or IGA) is backed by a dashboard, which is composed of widgets. Widgets, in turn, are built using:
- A Dataset (source data)
- A Chart (visual format)
Widgets
Widgets are the visual building blocks within a dashboard. Each widget shows a specific metric or trend using:
- A Dataset to define what data is shown
- A Chart to determine how it's displayed
Example:
A widget titled “Users with Unused App Access” might use a dataset of access logs and display a bar chart with usernames vs. last used date.
Updated 5 months ago