
Spends
The Spends tab shows how much your organization spends on an application. Use it to track spend against budget, compare actual spend with estimated cost, and review every transaction mapped to the application. For spend across all applications, see Spends Overview.
Access the Spends tab
- Go to Applications from the left navigation.
- Select the application. To learn more about the application page, see Application Overview.
- Select Spends from the application menu.
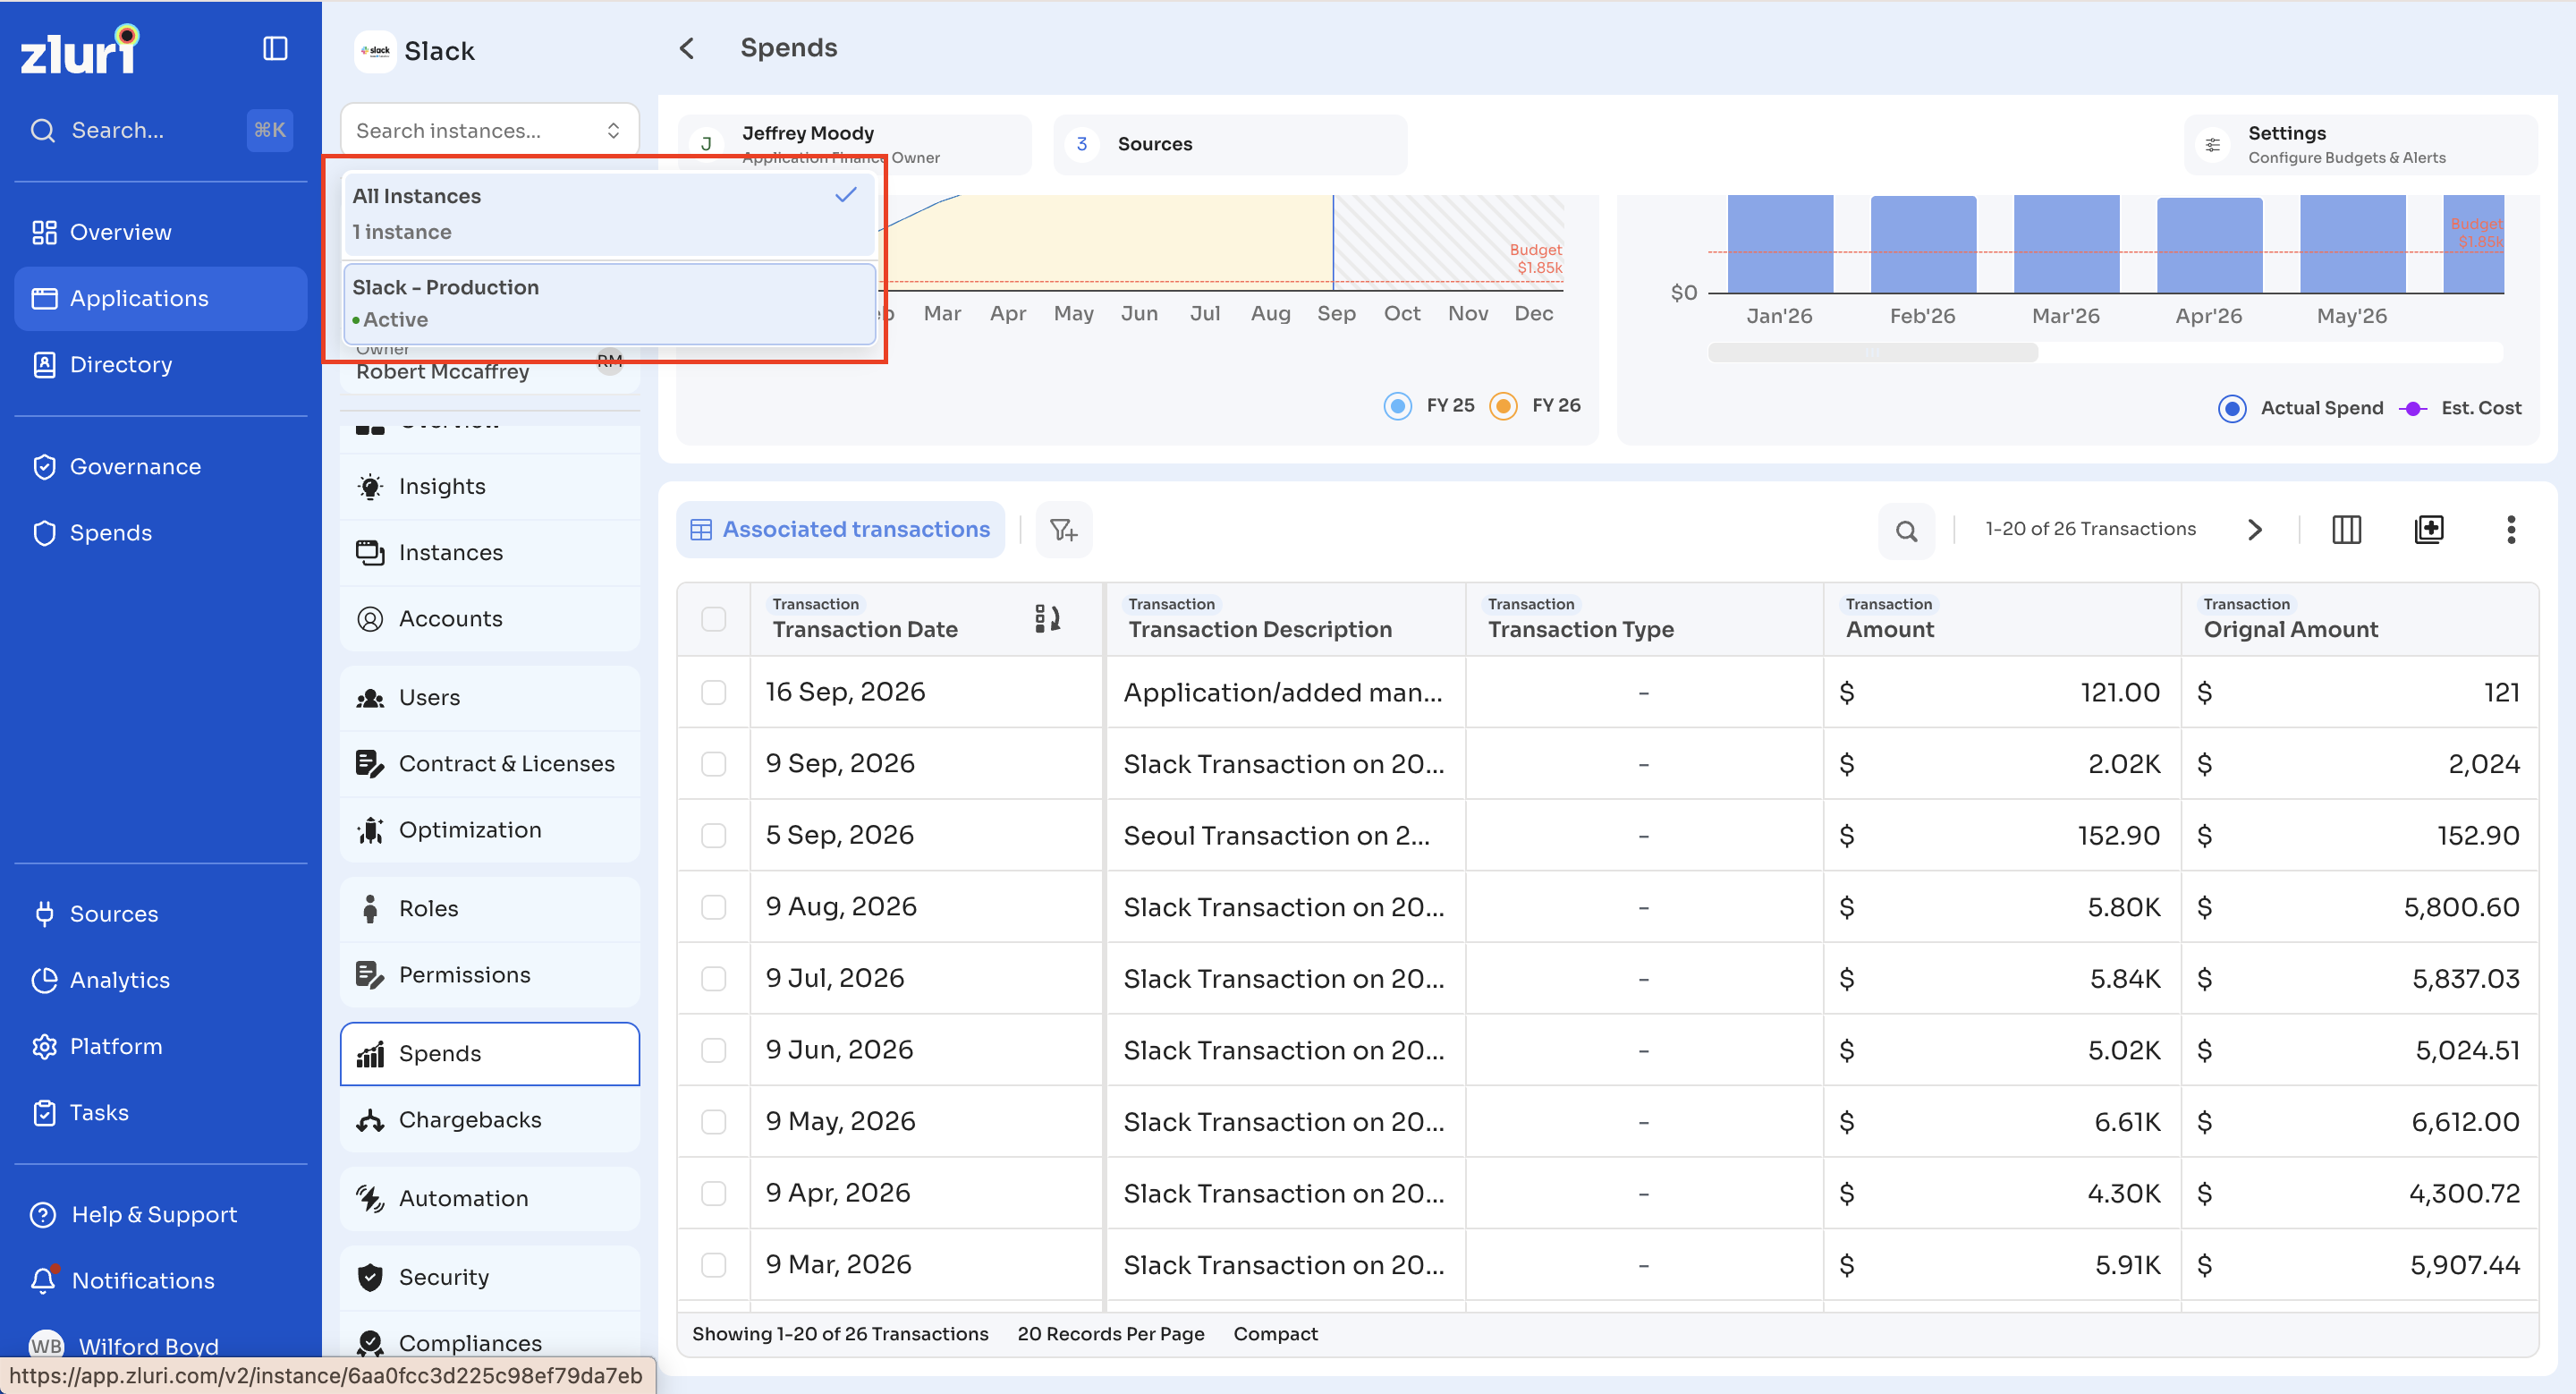
Use the instance dropdown at the top of the application menu to view spend for All Instances or a single instance. To learn more, see Instances.
Finance owner, sources, and settings
The top of the tab shows three items:
-
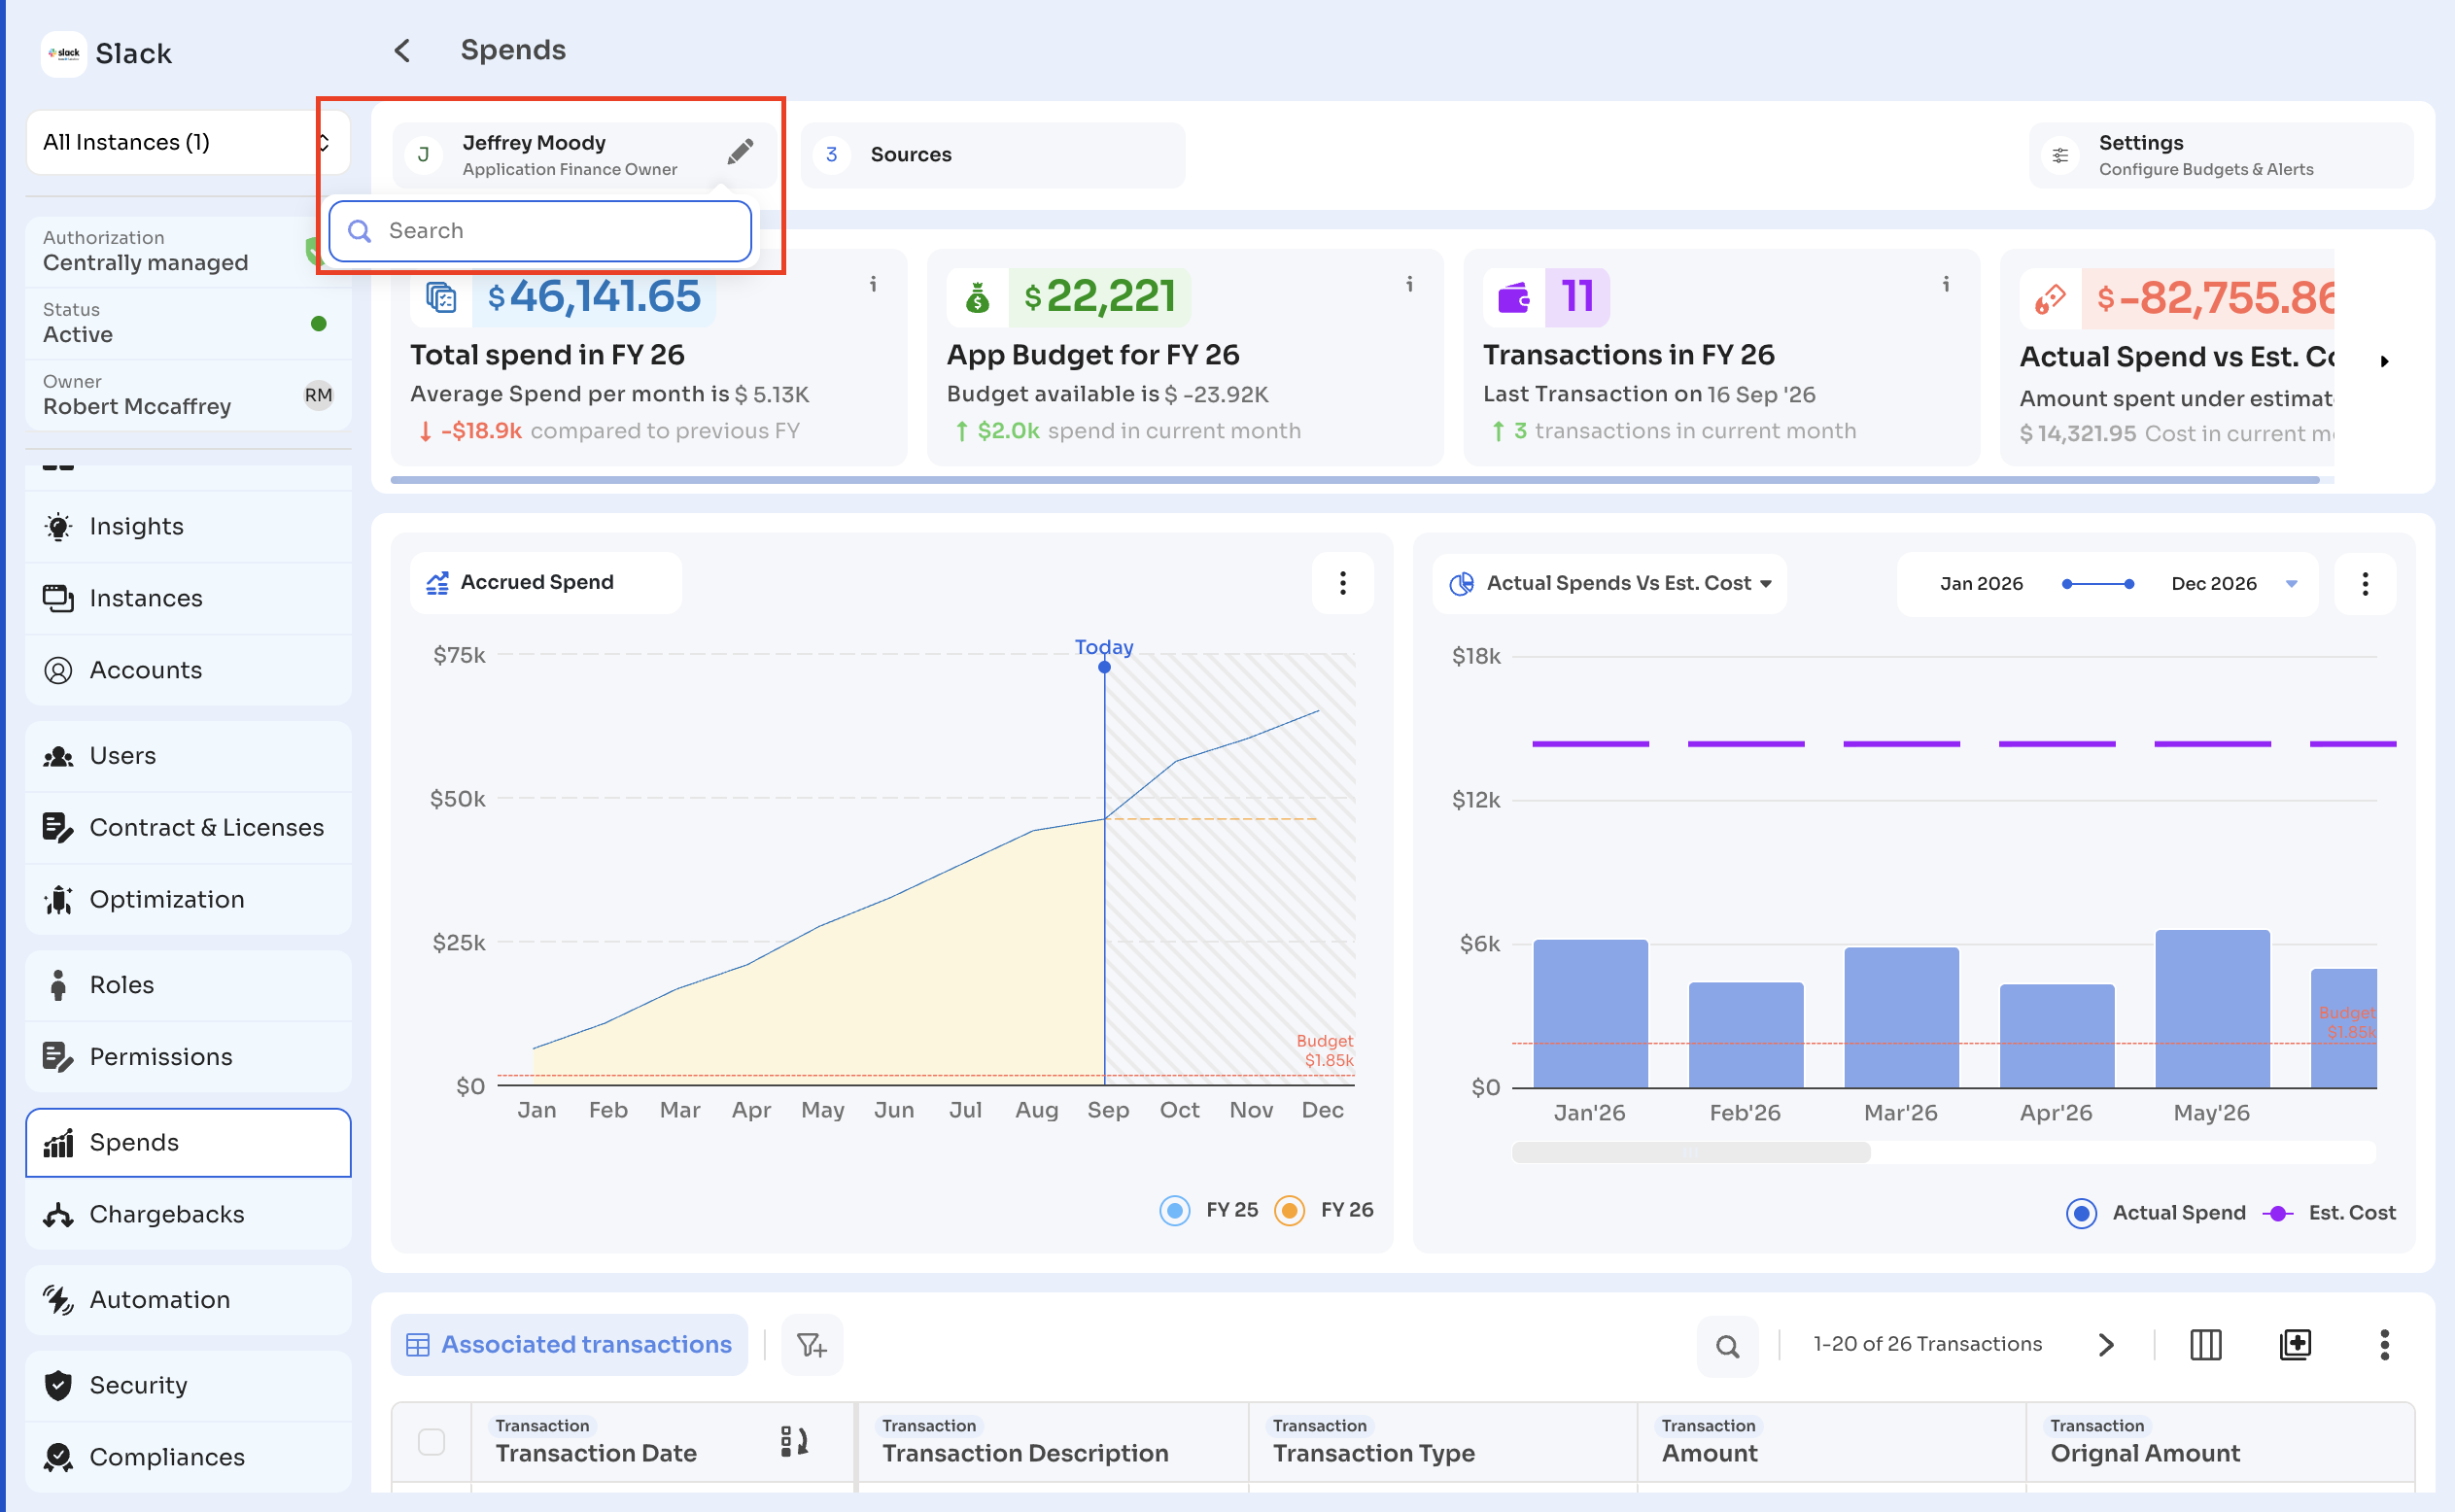
Application Finance Owner: The user responsible for the application's spend.
-
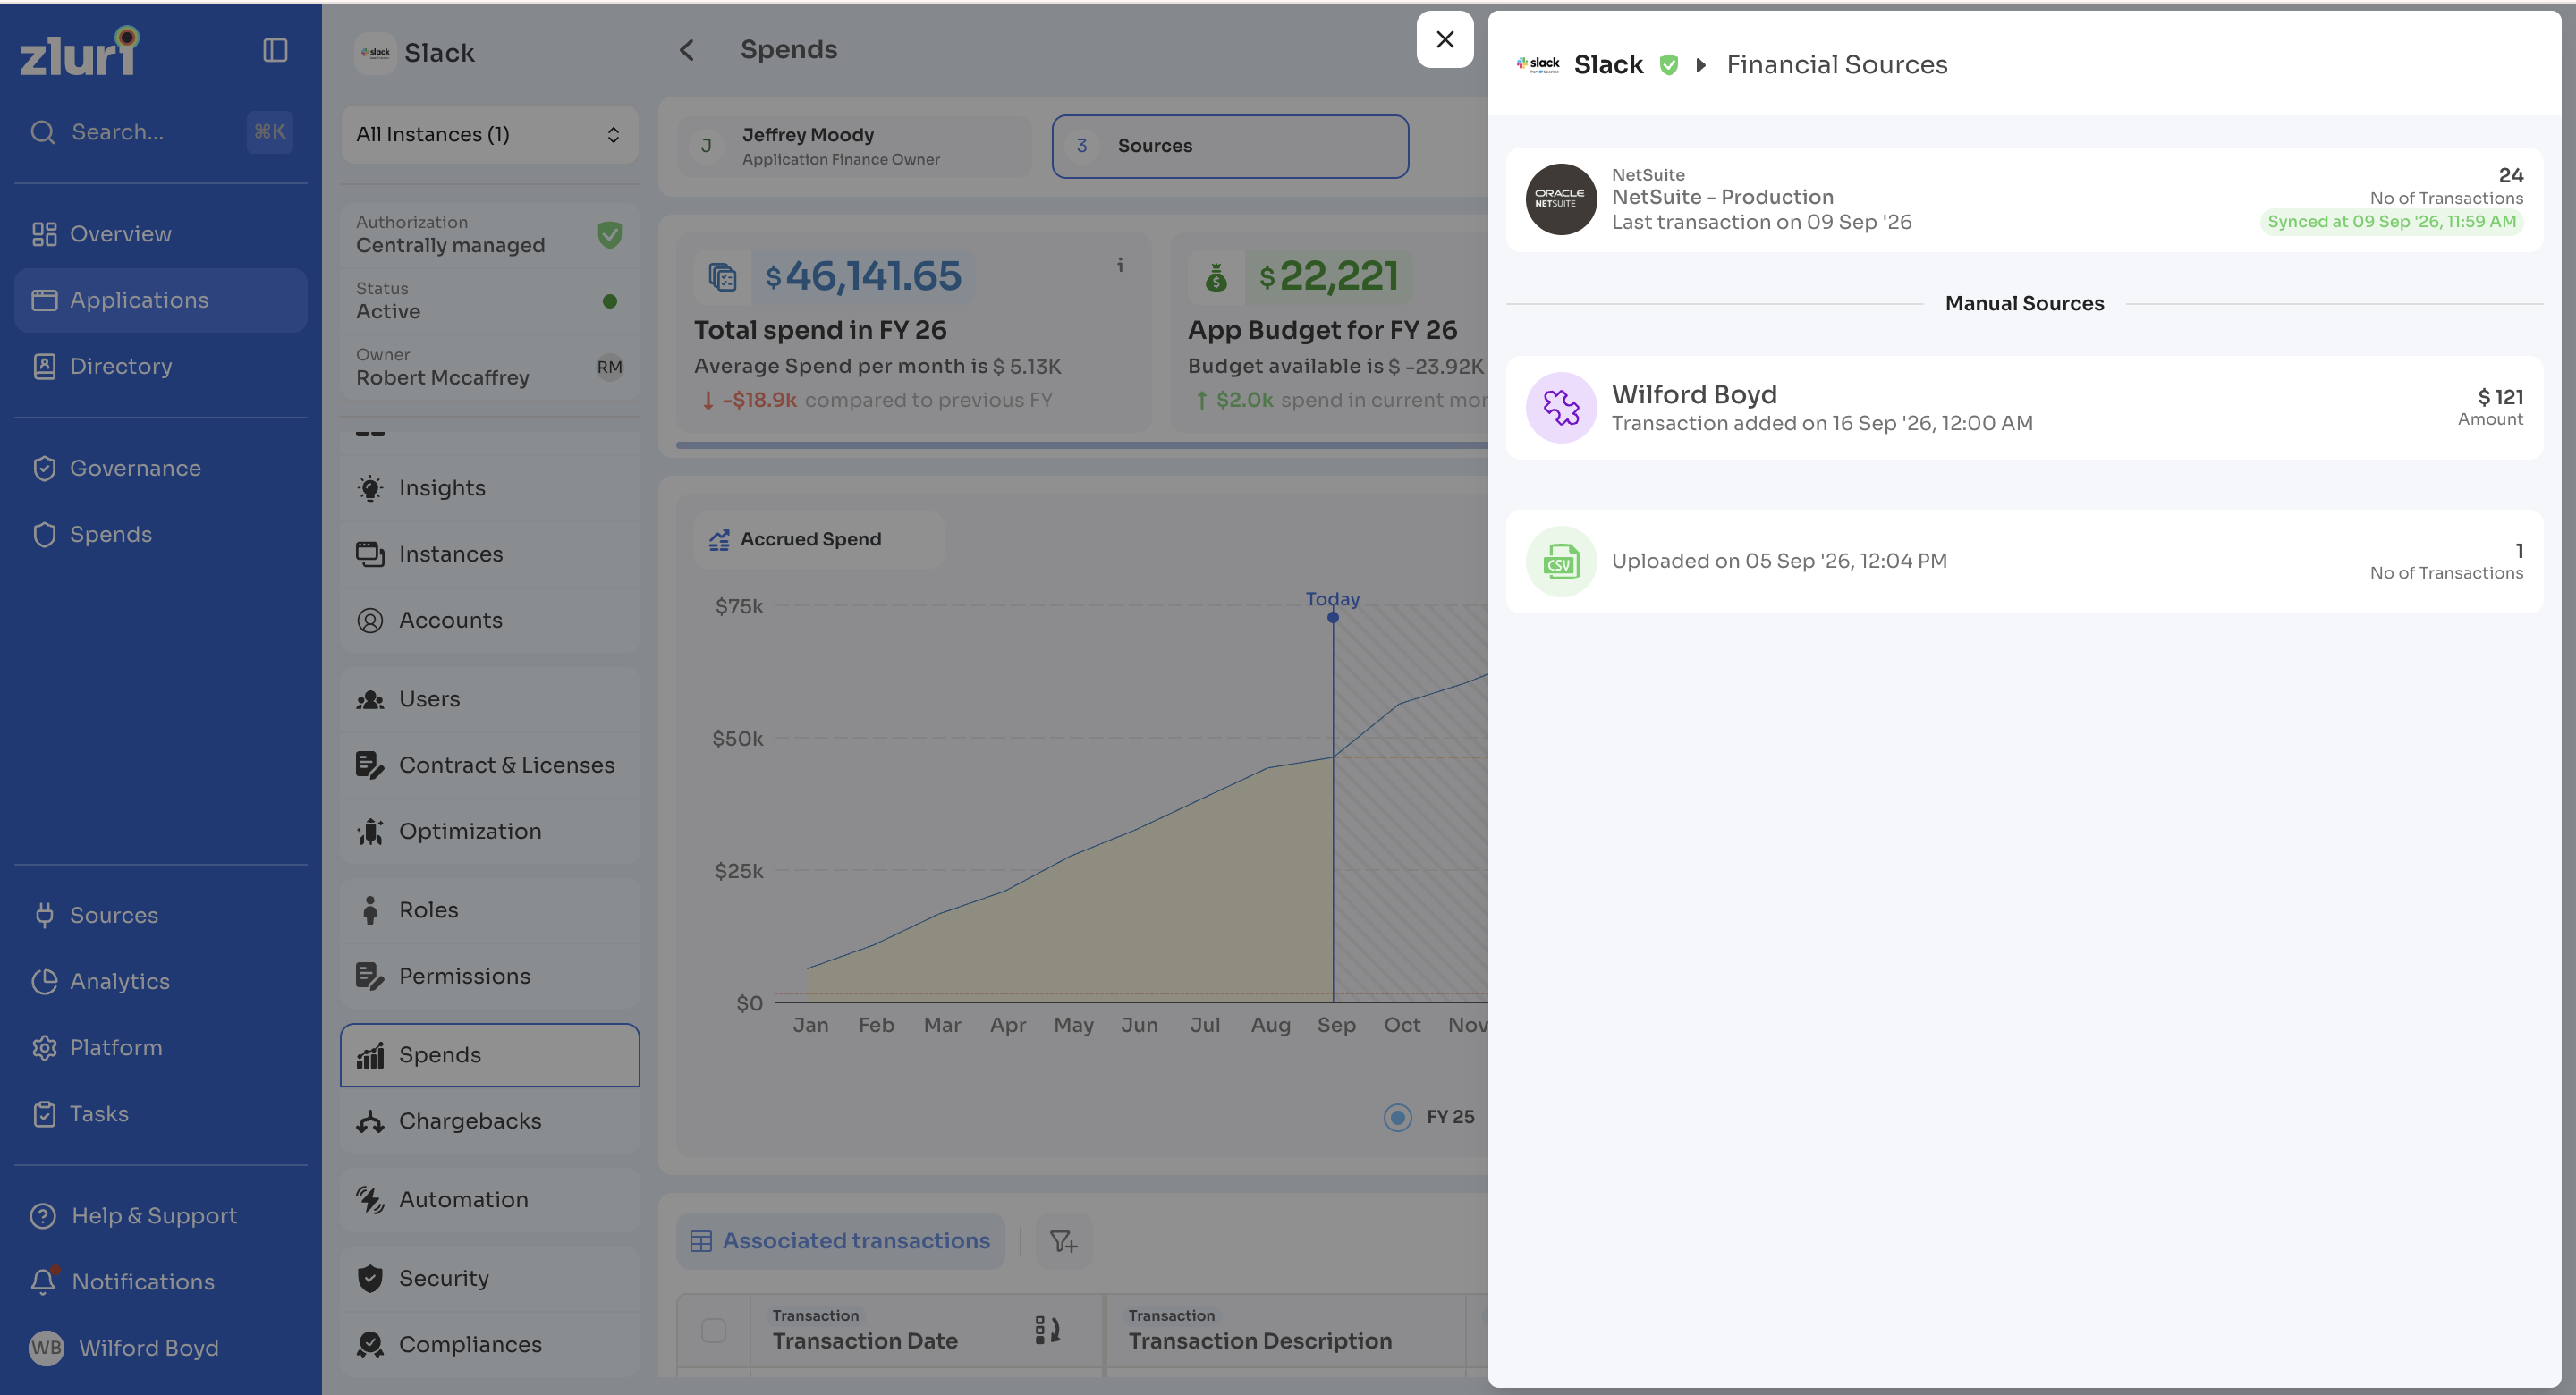
Sources: The number of sources that send spend data for the application.
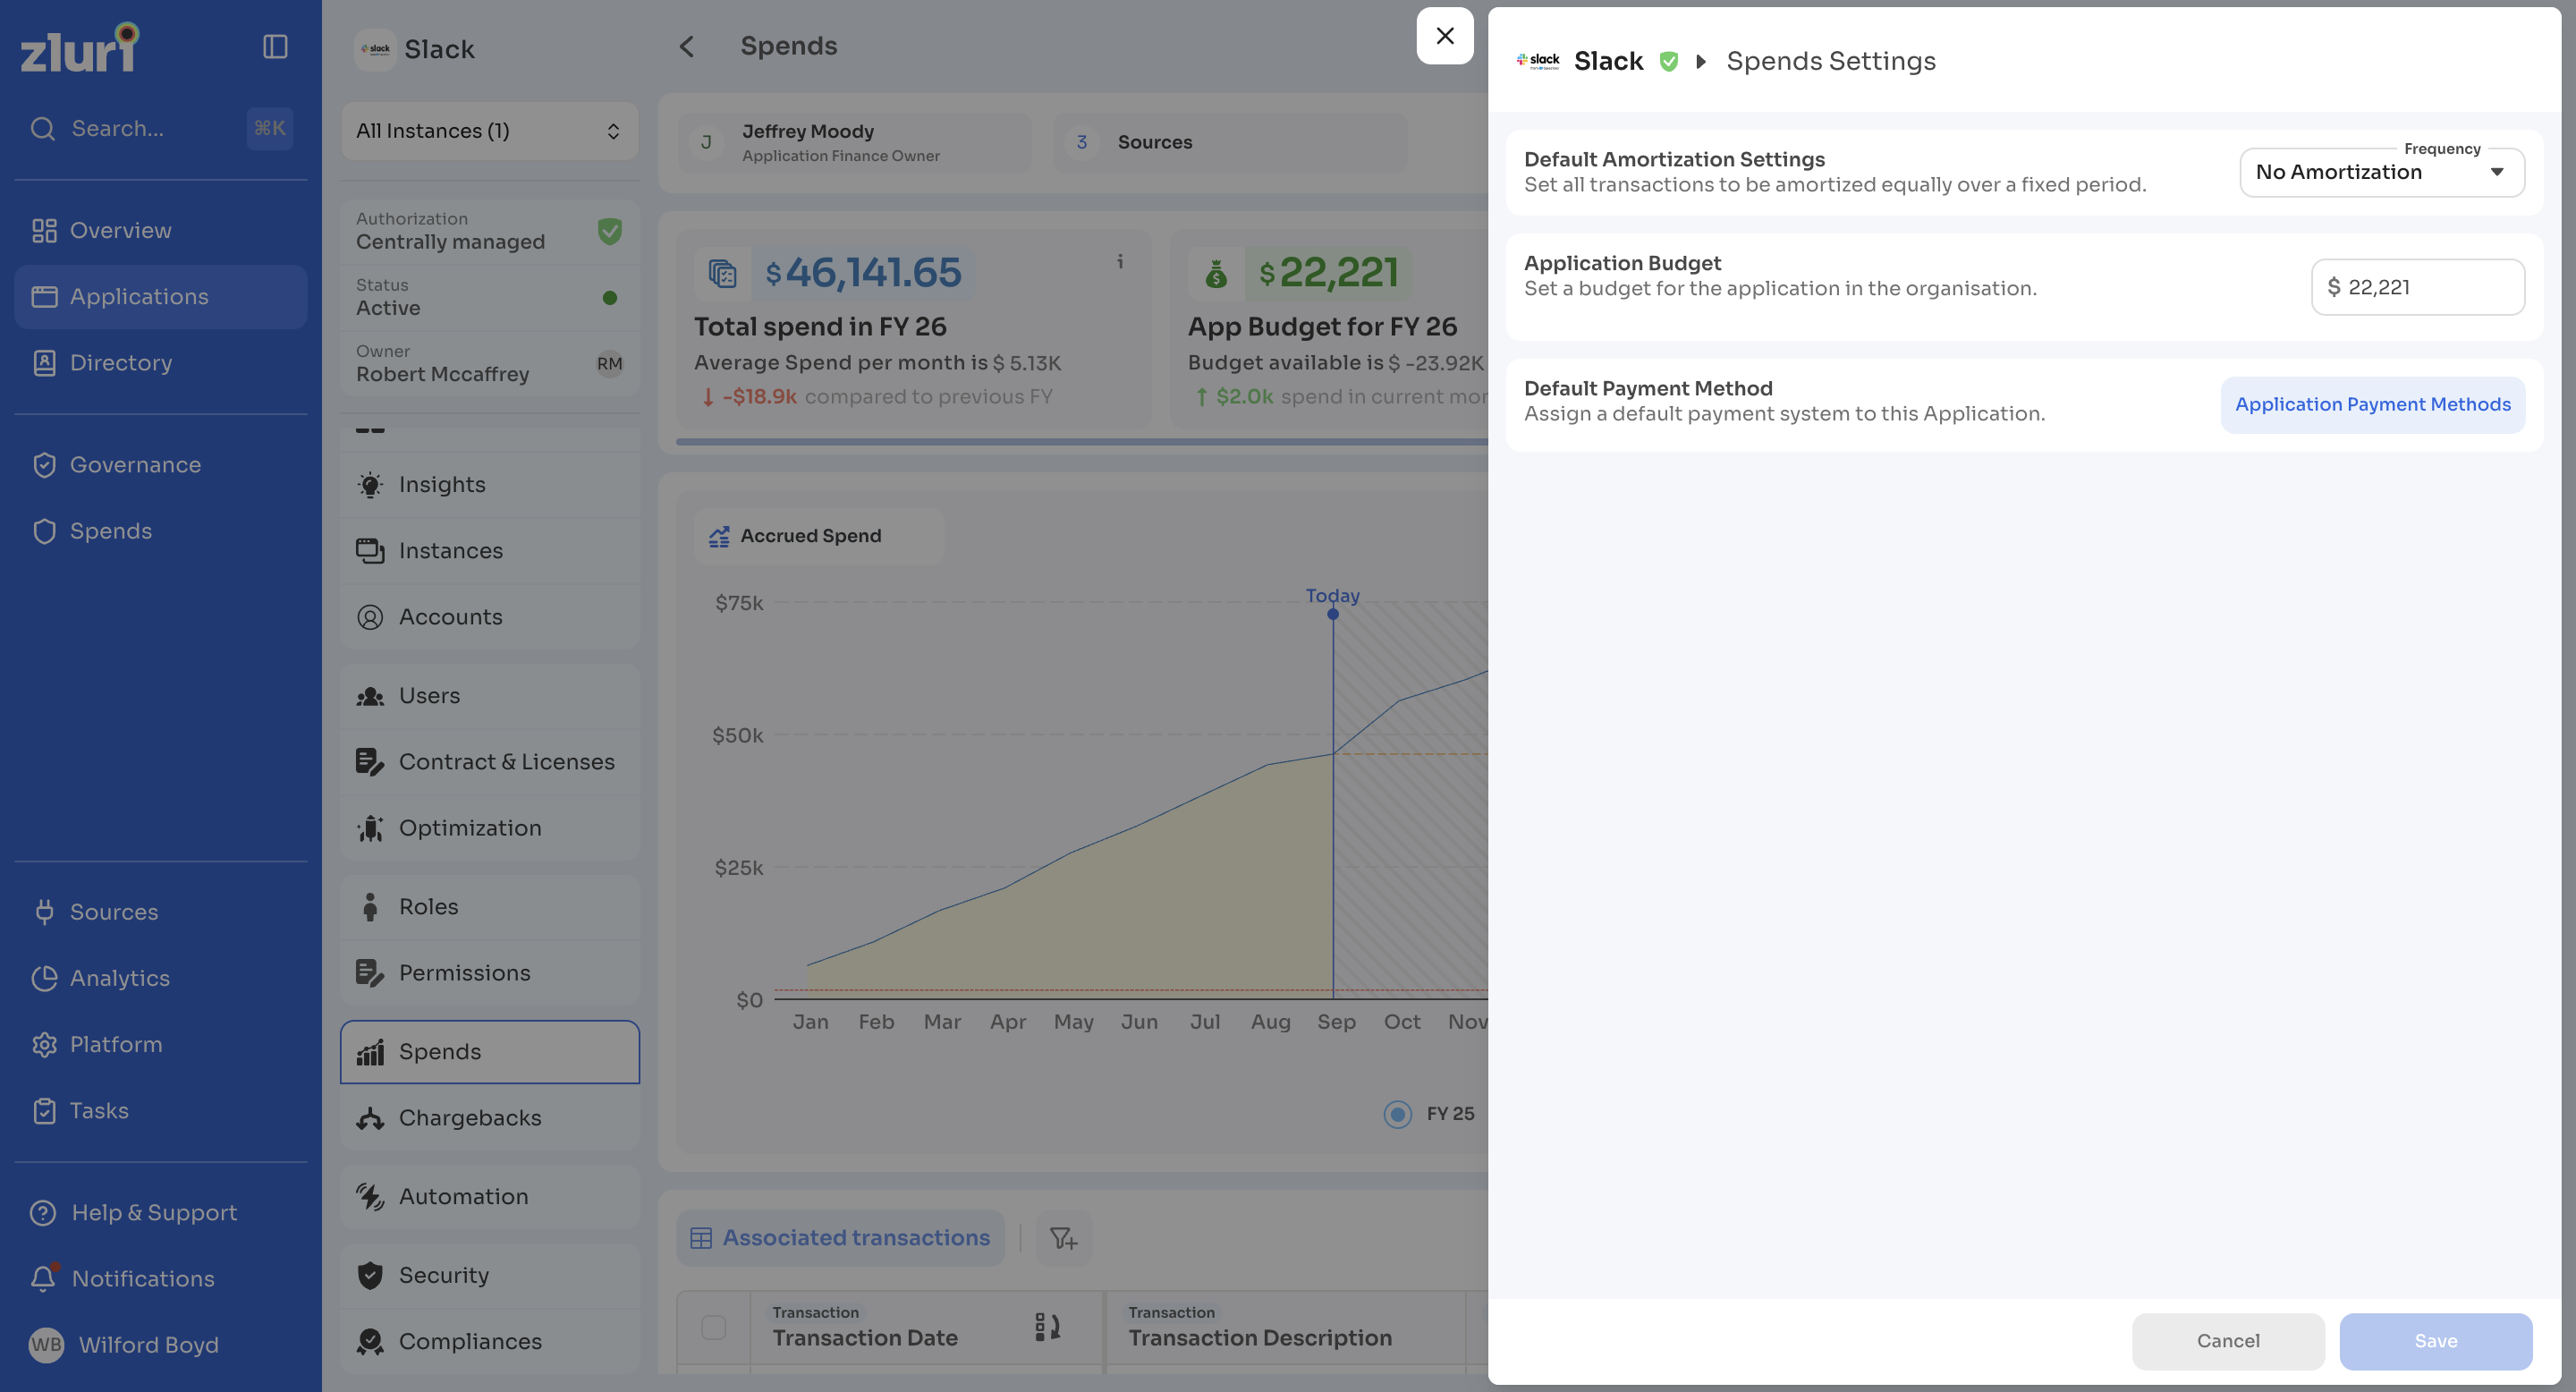
- Settings: Opens the settings to configure budgets and alerts for the application.
Summary cards
The summary cards show the application's spend for the current fiscal year.
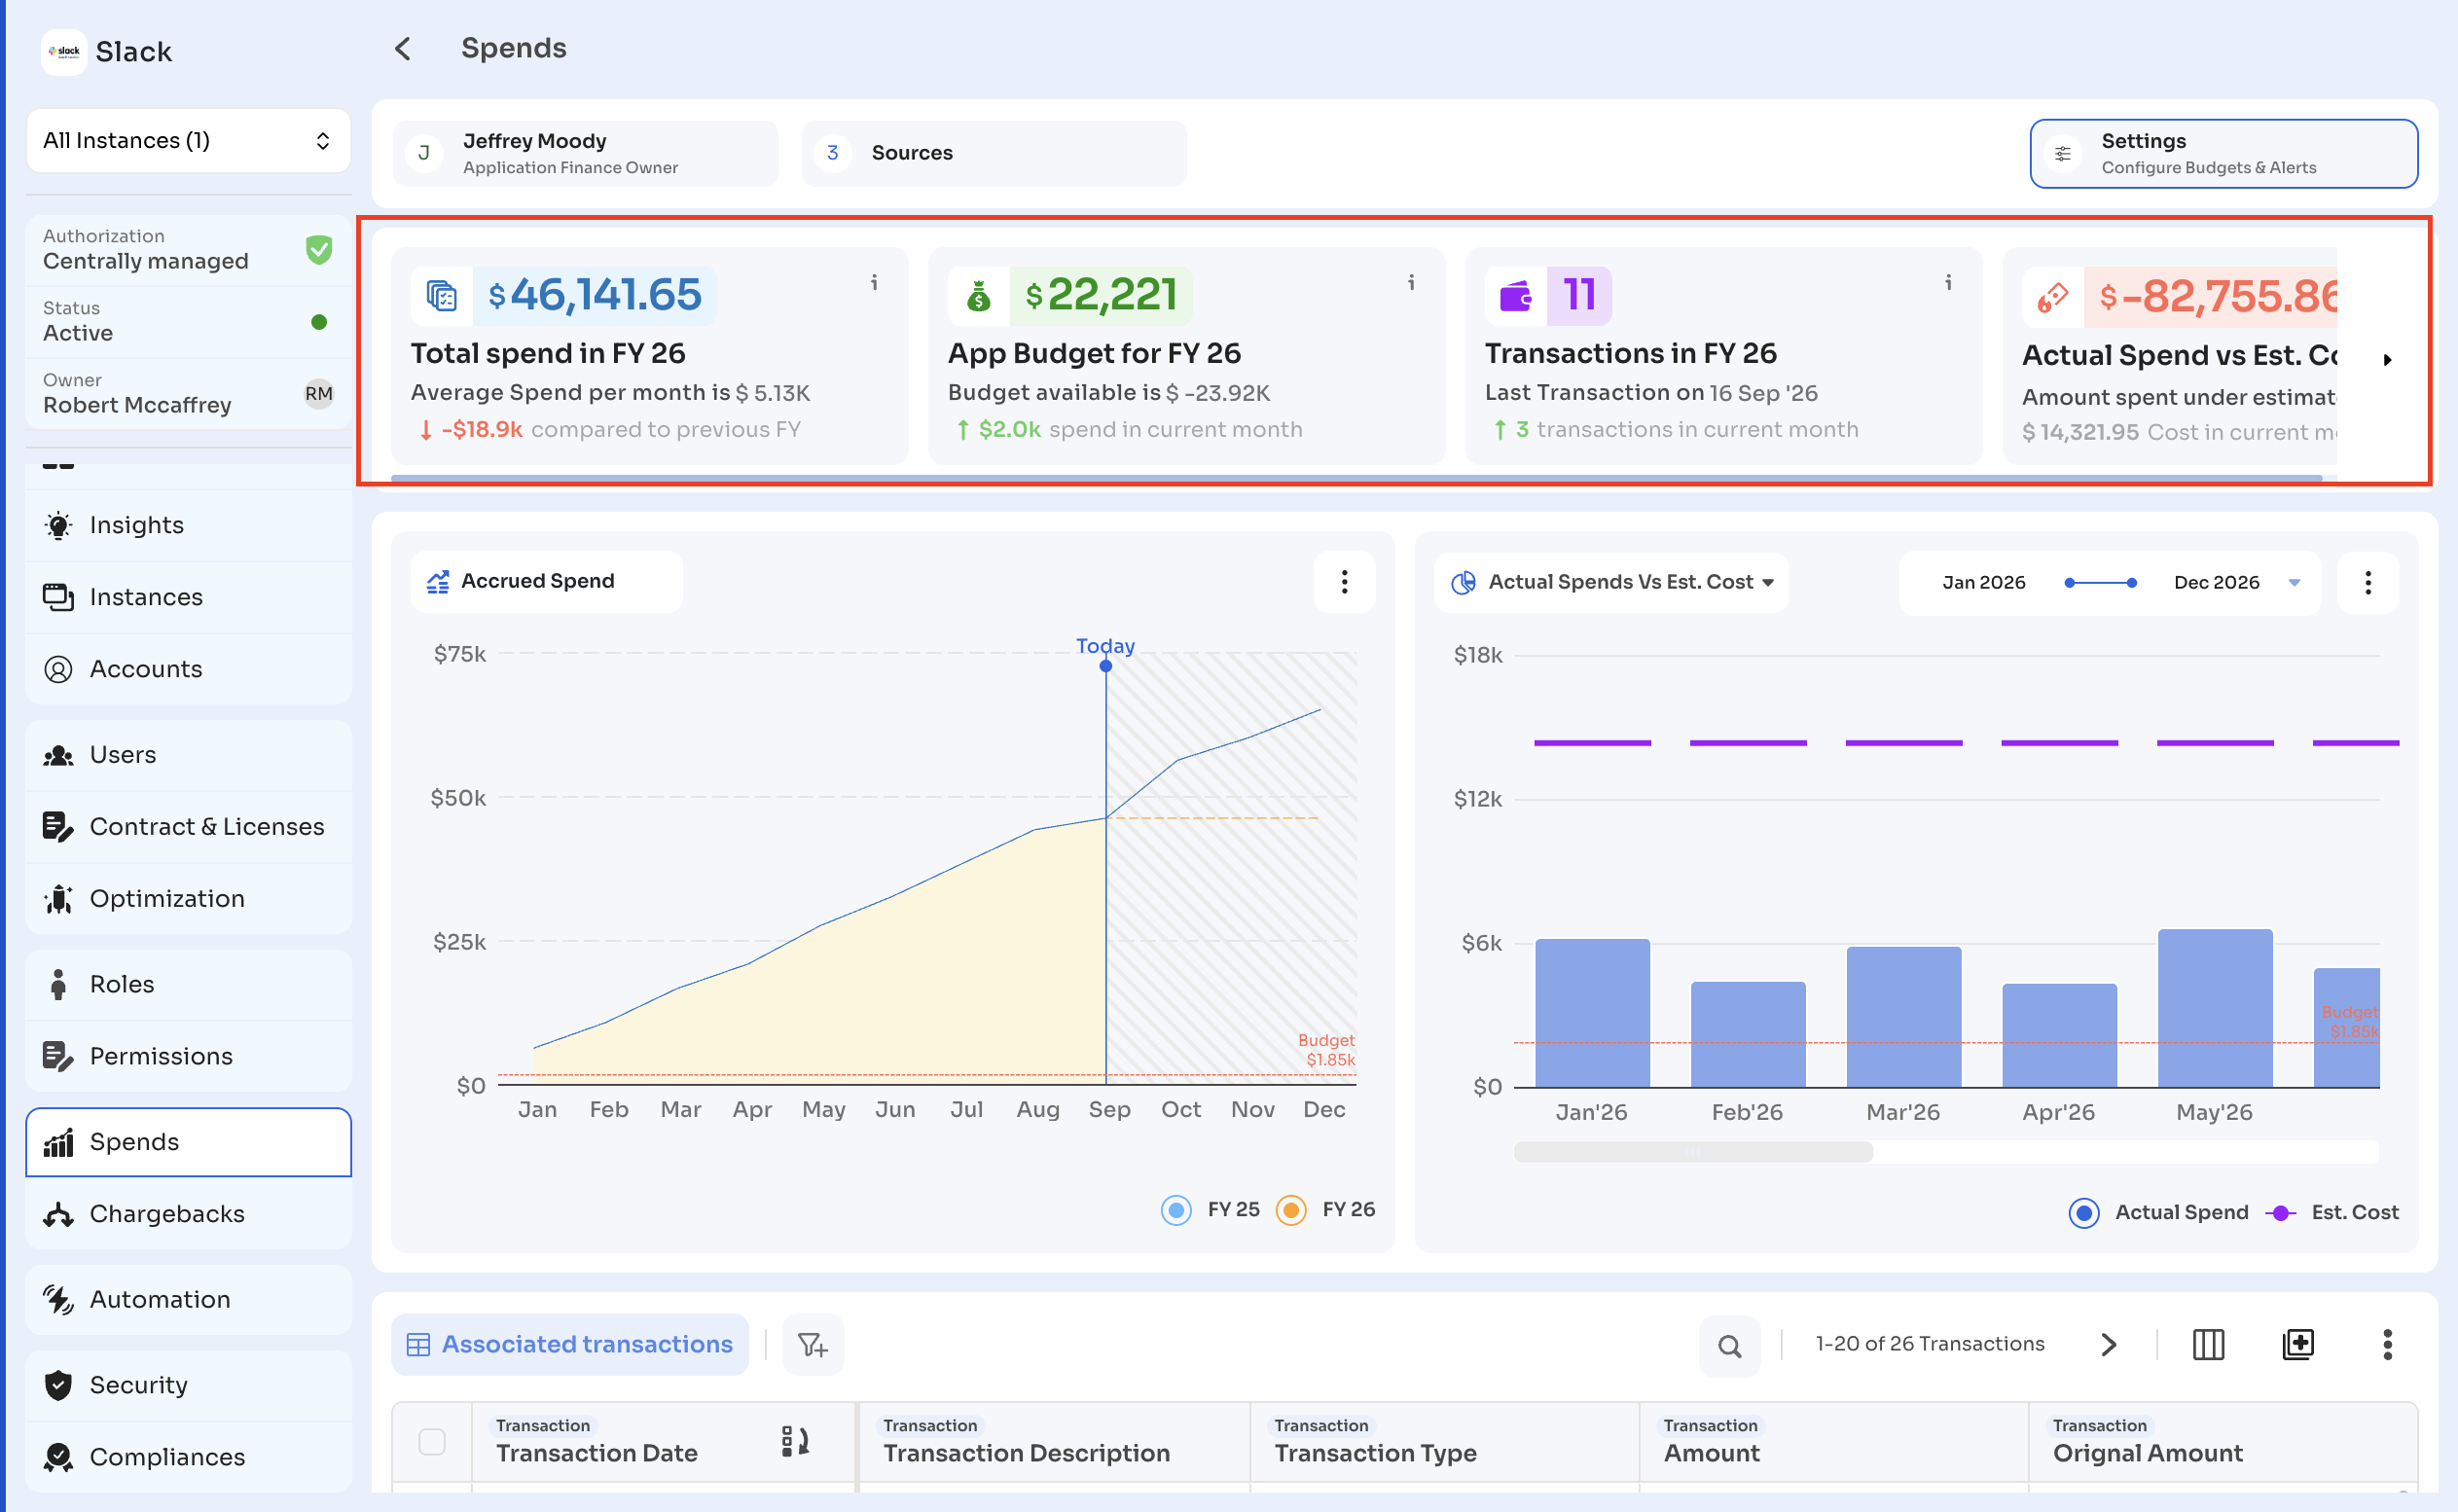
| Card | What it shows |
|---|---|
| Total spend | The total spend for the fiscal year, the average spend per month, and the change compared to the previous fiscal year. |
| App Budget | The budget set for the fiscal year, the budget still available, and the spend in the current month. |
| Transactions | The number of transactions in the fiscal year, the date of the last transaction, and the number of transactions in the current month. |
| Actual Spend vs Est. Cost | The difference between actual spend and estimated cost, and the cost in the current month. |
Accrued Spend chart
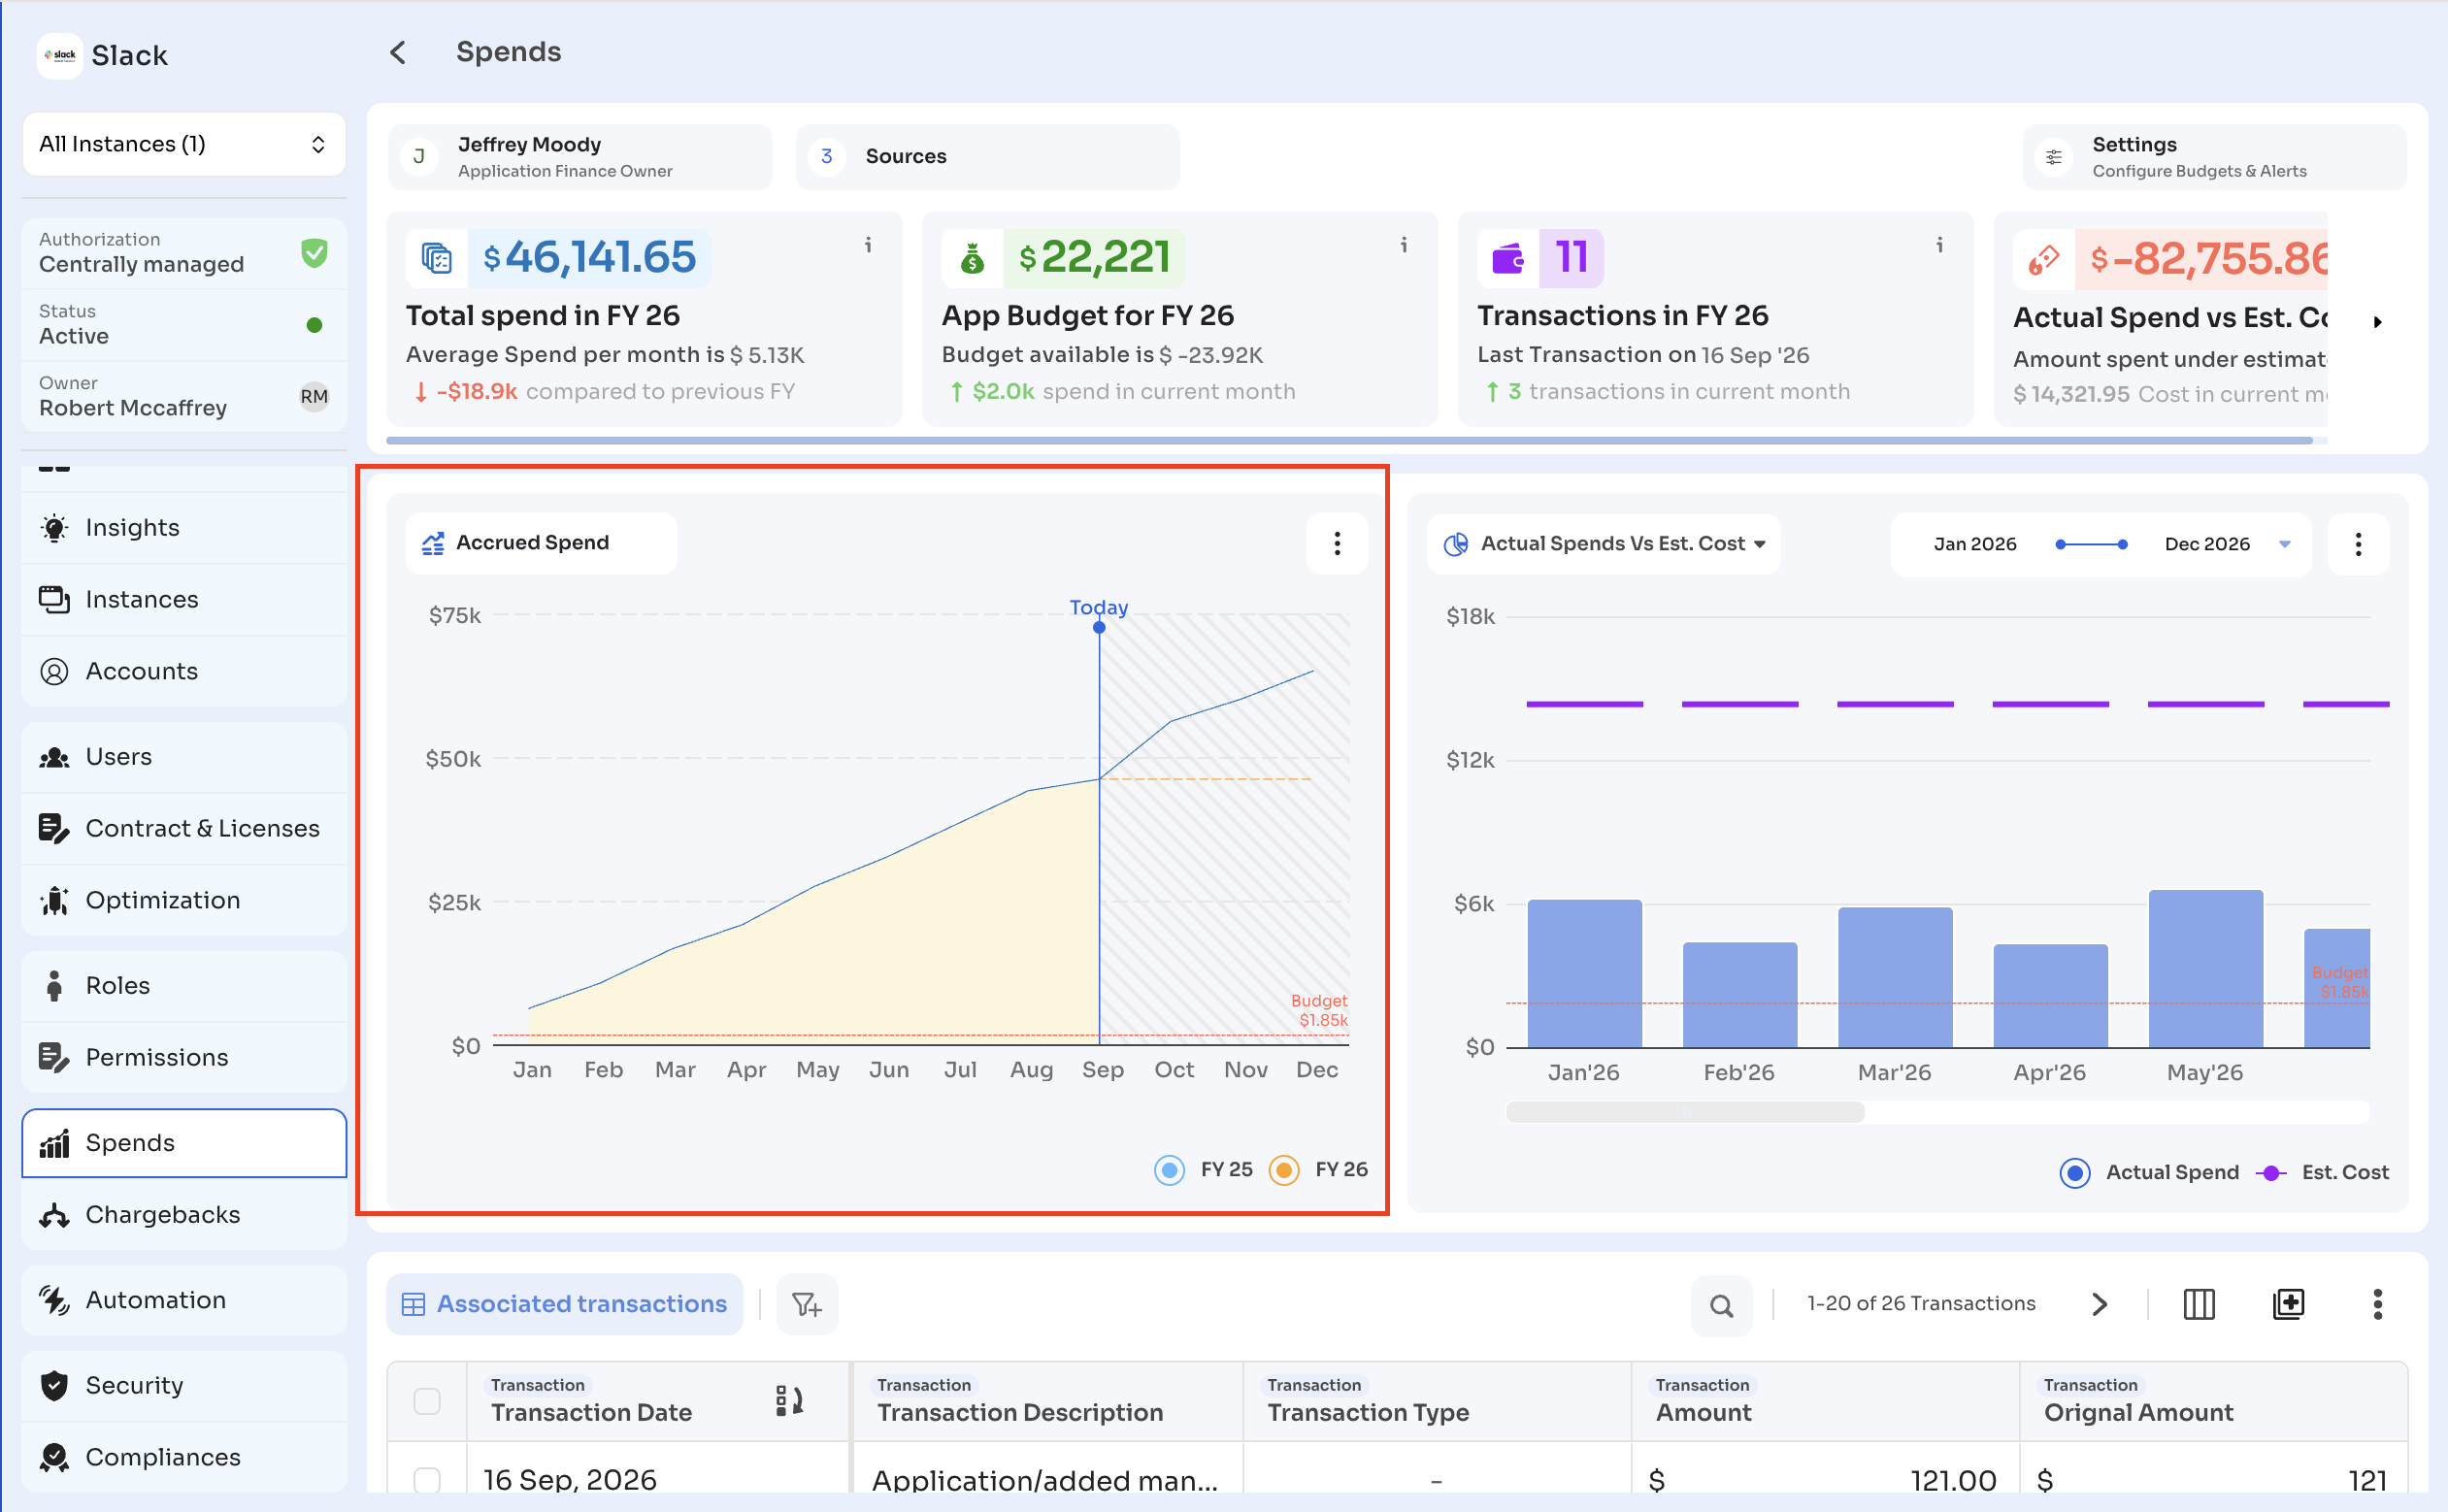
The Accrued Spend chart shows the cumulative spend for the application across the fiscal year. It compares the current fiscal year with the previous one, for example FY 25 and FY 26.
-
The shaded area shows spend up to the Today marker.
-
The hatched area after Today shows the projected spend for the rest of the year.
-
The Budget line shows the budget set for the application.
Actual Spends Vs Est. Cost chart
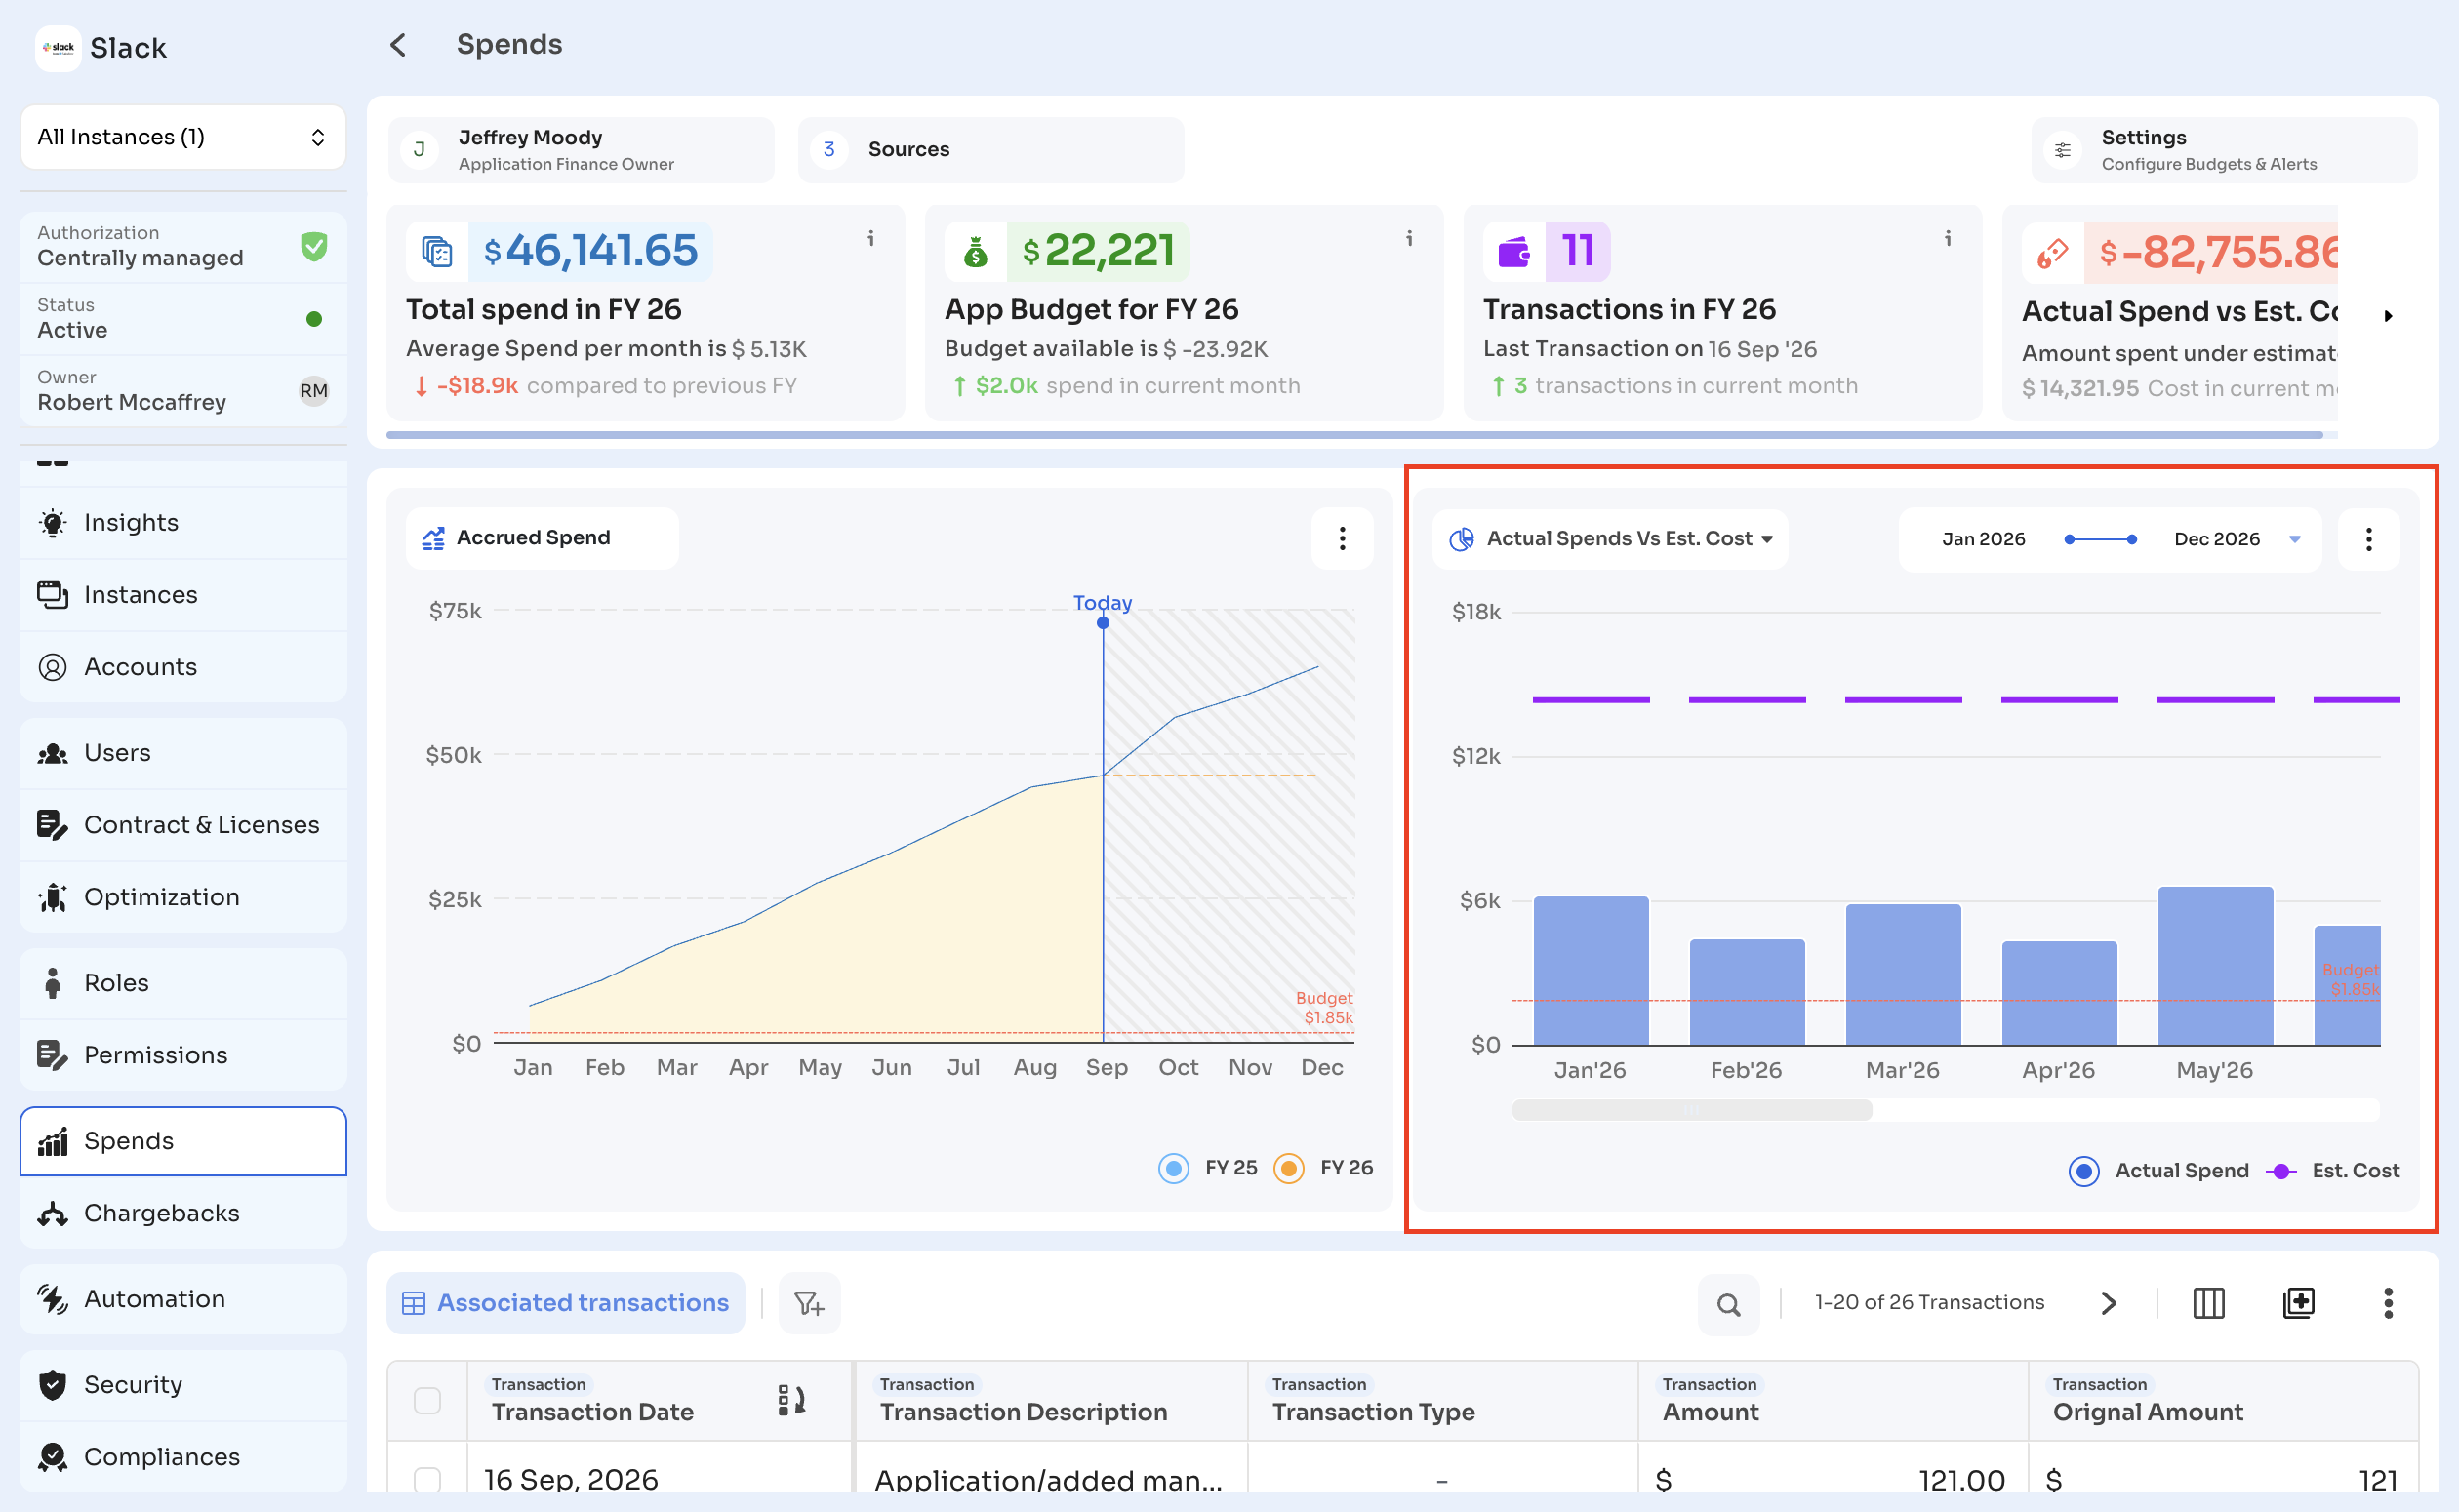
The Actual Spends Vs Est. Cost chart compares what you spend each month with the estimated cost of the application.
- Actual Spend bars show the money spent each month.
- The Est. Cost line shows the cost expected from the application's contracts. To manage contracts, see Contracts.
- The Budget line shows the budget set for the application.
Actual spend exceeds estimated cost when users buy licenses outside the contract. To learn more, see Cost vs. Spend.
To work with the chart:
- Select the date range dropdown to change the start and end months.
- Select the more options menu (⋮) to Refresh the chart, Download PNG, or Download PDF.
Associated transactions
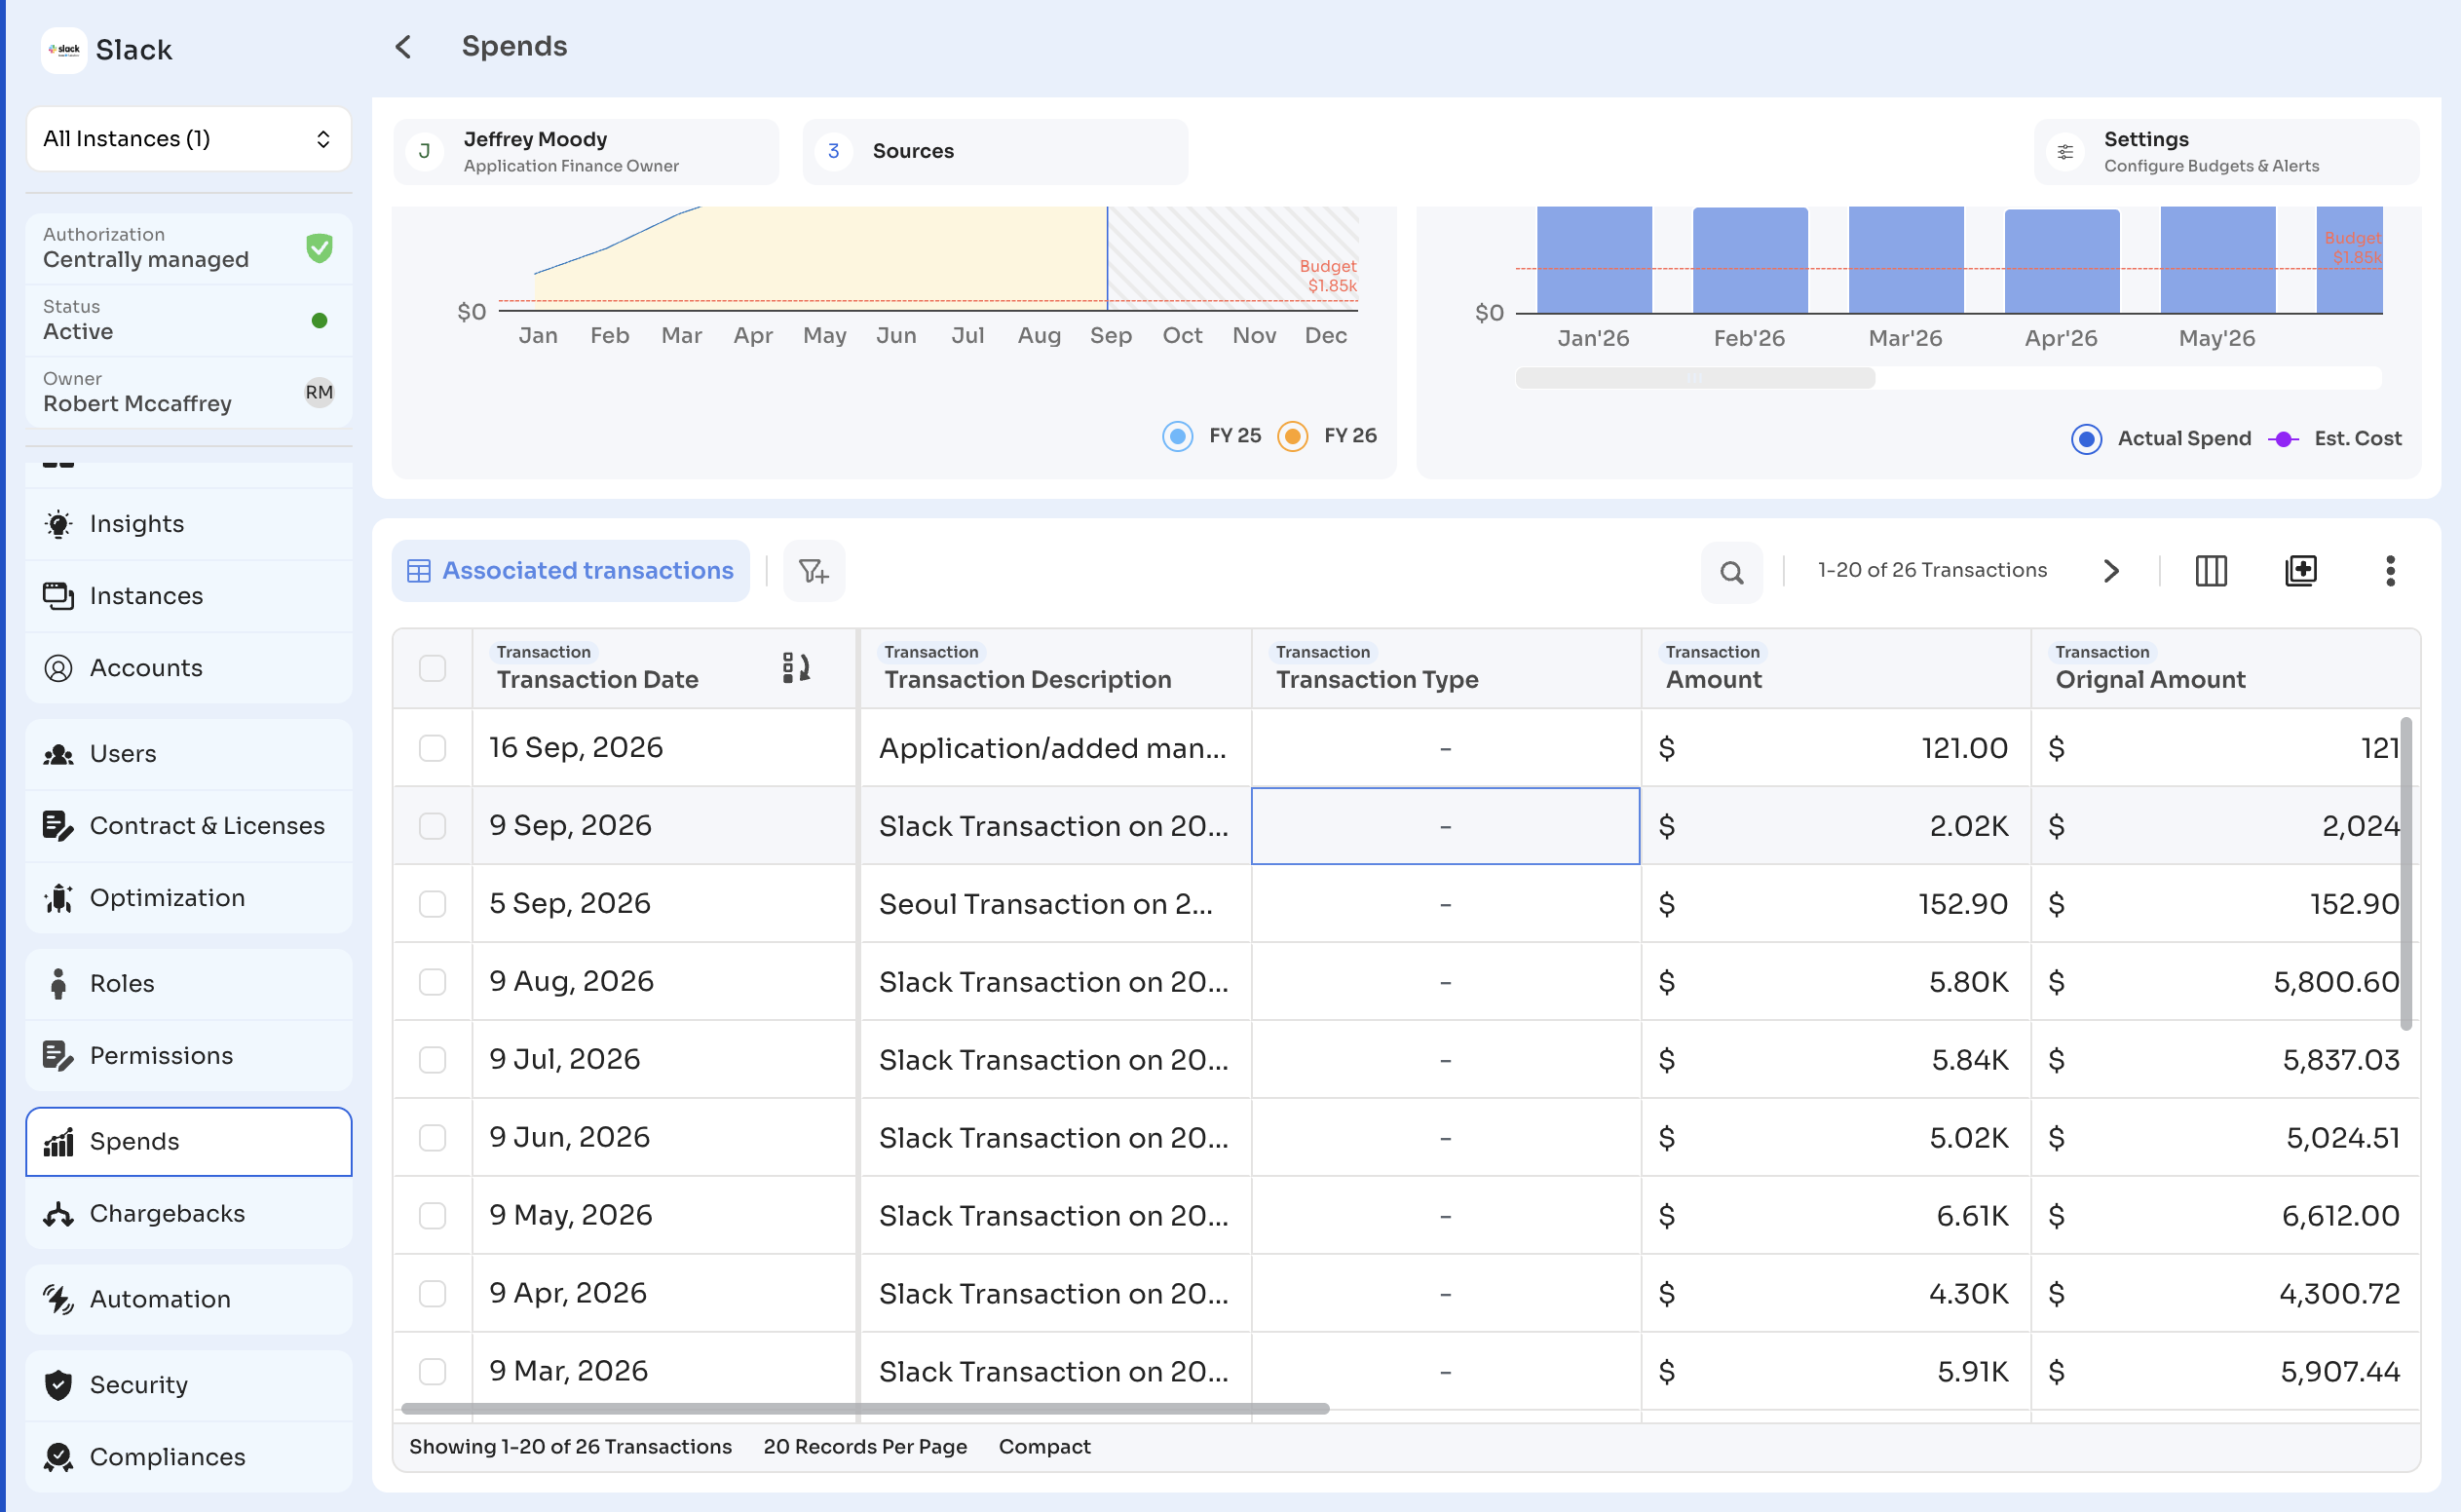
The Associated transactions table lists every transaction mapped to the application. To learn how transactions are mapped, see Transactions and Automation.
Column headers are grouped by category (Transaction and Spend). Scroll the table horizontally to see all columns.
| Column | Category | Description |
|---|---|---|
| Transaction Date | Transaction | The date of the transaction. |
| Transaction Description | Transaction | The description from the transaction source. |
| Transaction Type | Transaction | The type of transaction. |
| Amount | Transaction | The transaction amount in your organization's currency. |
| Original Amount | Transaction | The transaction amount in the currency of the source. |
| Vendor | Transaction | The vendor for the transaction. Select Add Vendor to assign one if none is set. |
| Source | Transaction | The source the transaction came from, for example a NetSuite instance. |
| Payment Method | Transaction | The payment method used, with the masked account or card number. |
| Account Name | Transaction | The account name for the transaction. |
| Amortization Start Date | Spend | The date amortization of the spend begins. |
| Amortization End Date | Spend | The date amortization of the spend ends. |
Add transactions
Select the add icon at the top of the table, then choose one of the following:
- Add Transaction: add a single transaction manually.
- Bulk Upload CSV: upload multiple transactions from a CSV file.
Change the payment method for a transaction
- Hover over the Payment Method cell for the transaction and select the edit icon.
- Search for or select a payment method from the list, for example Central bank or Other Payment.
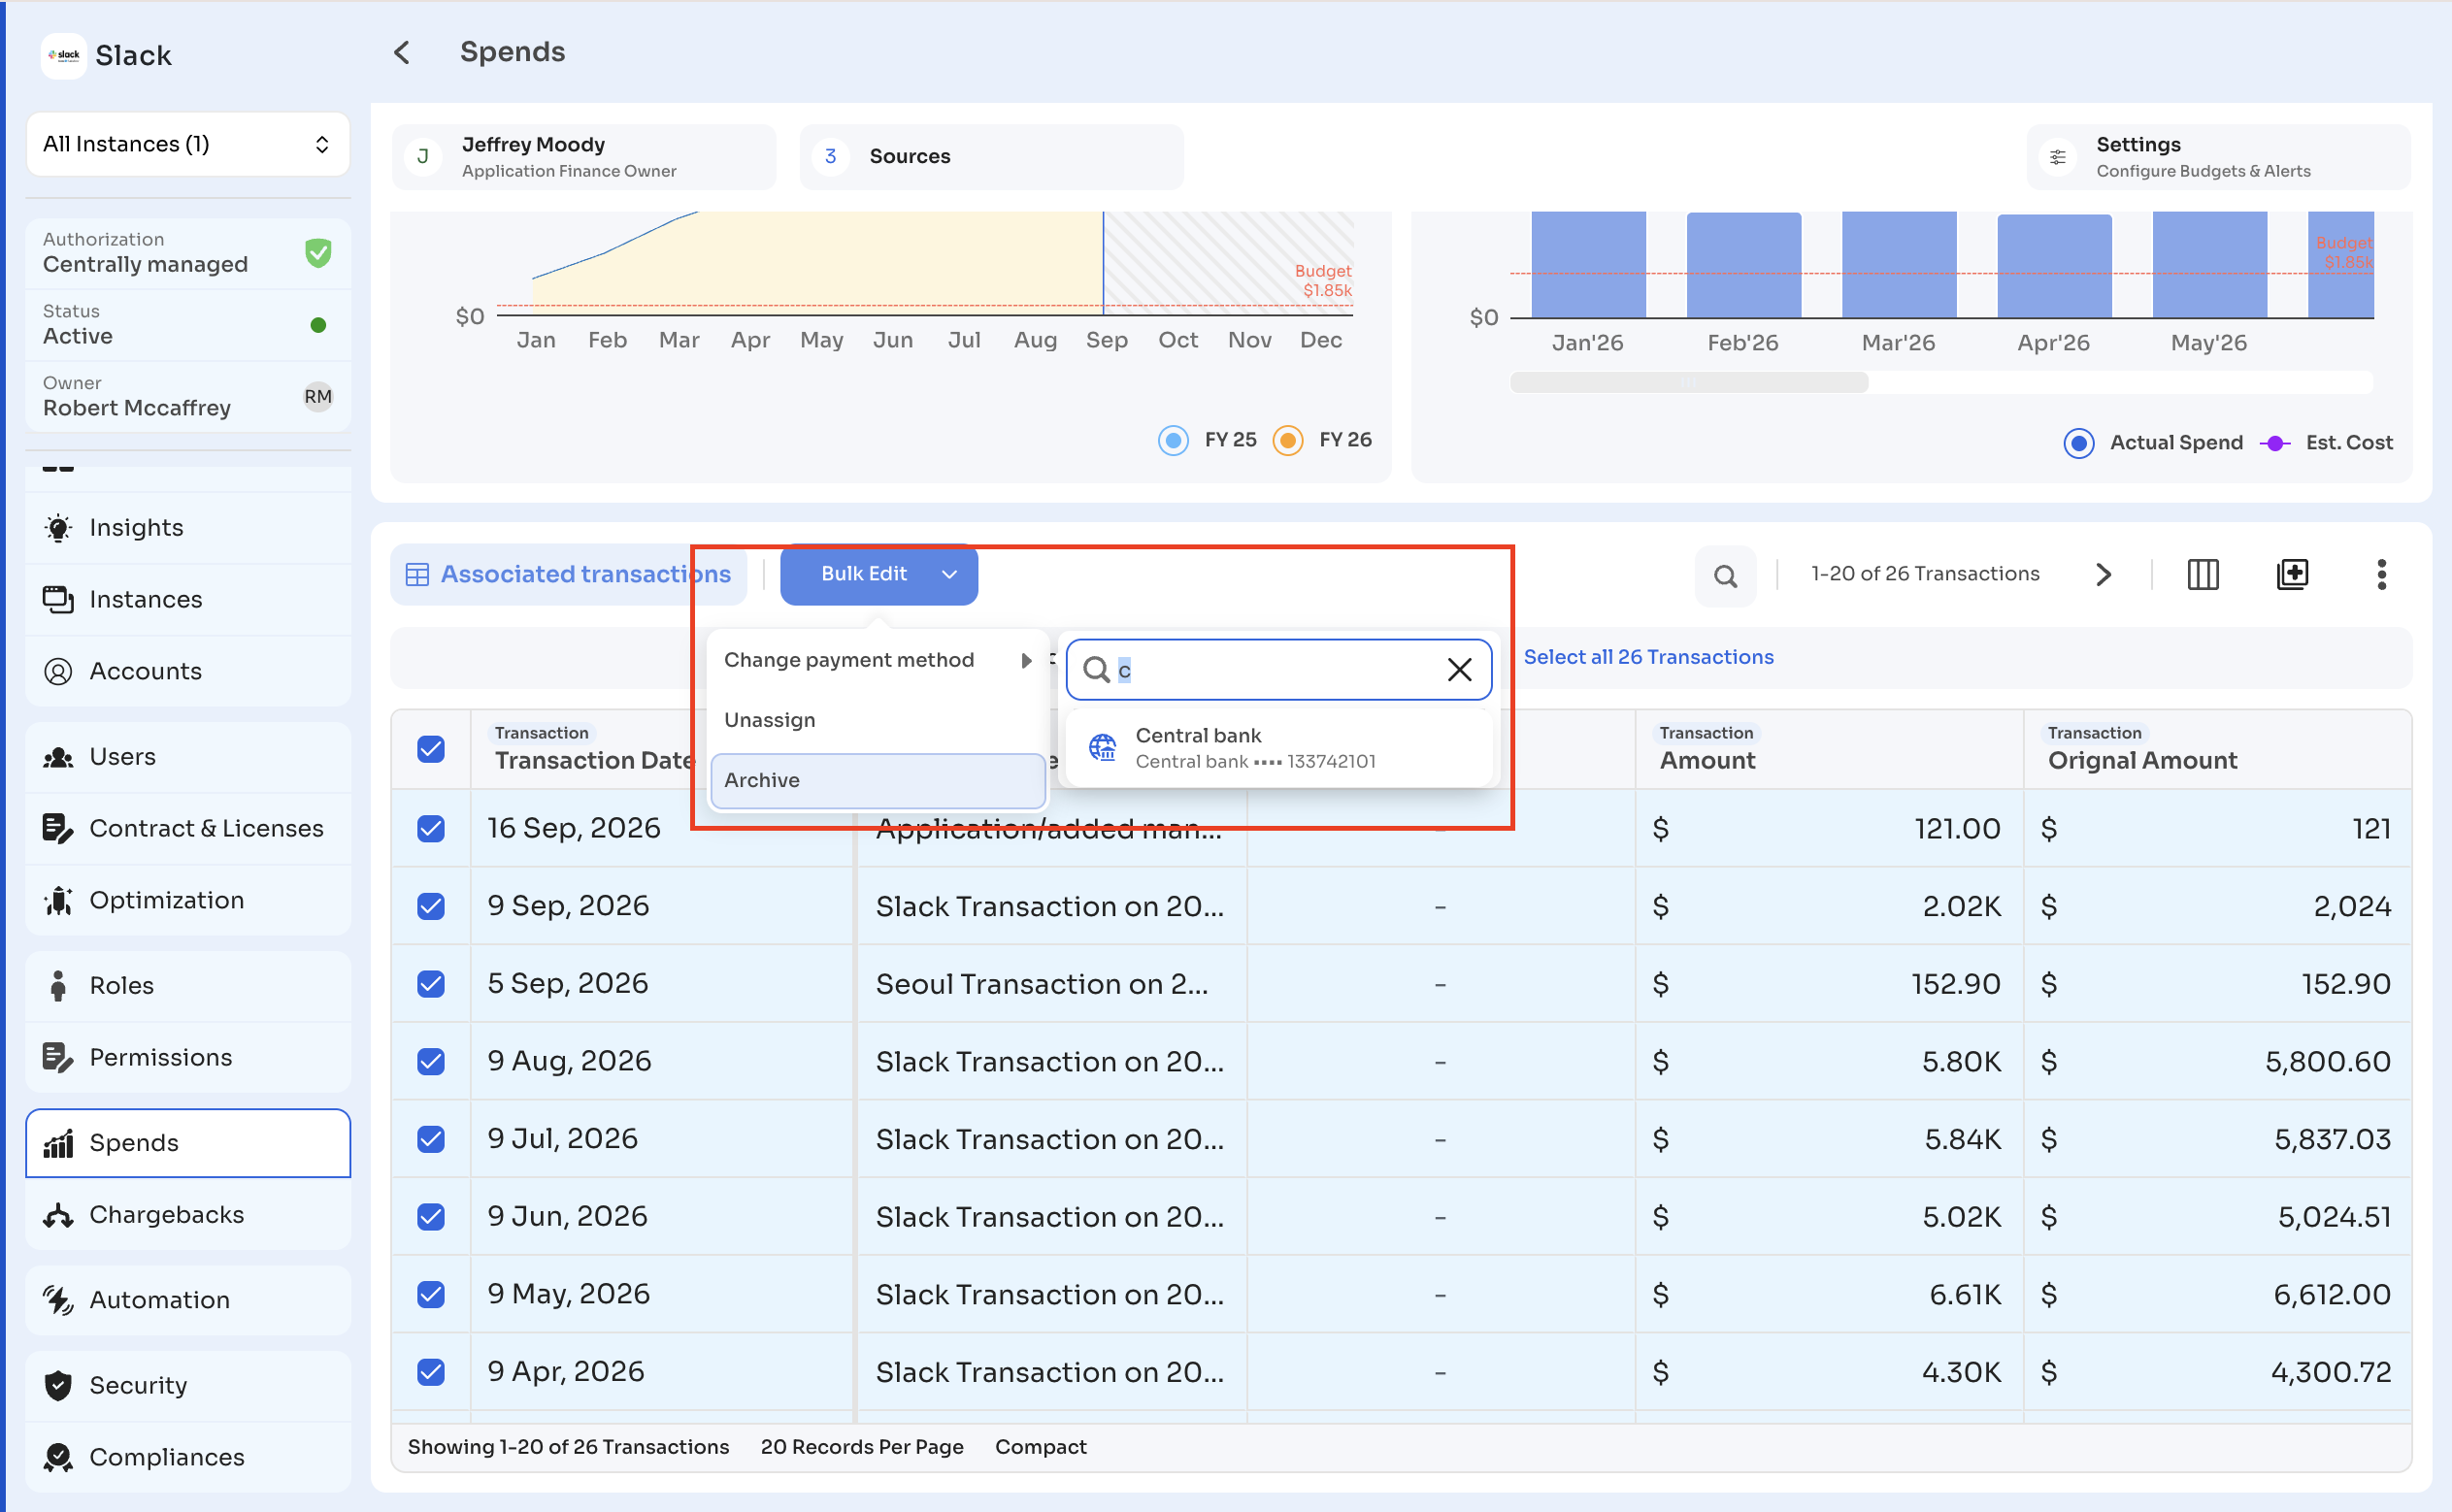
Bulk edit transactions
- Select the checkbox next to each transaction you want to edit. To select every transaction on the page, select the checkbox in the header row.
- To include transactions on other pages, select Select all [N] Transactions in the banner above the table.
- Select Bulk Edit, then choose an action:
- Change payment method
- Unassign
- Archive
Work with the table
-
Select the search icon to find a transaction.
-
Select the filter icon to filter transactions.
-
Select the columns icon to show or hide columns.
-
Select the more options menu (⋮) to Refresh the table, change the View Density, Export View, or create a Custom Export.
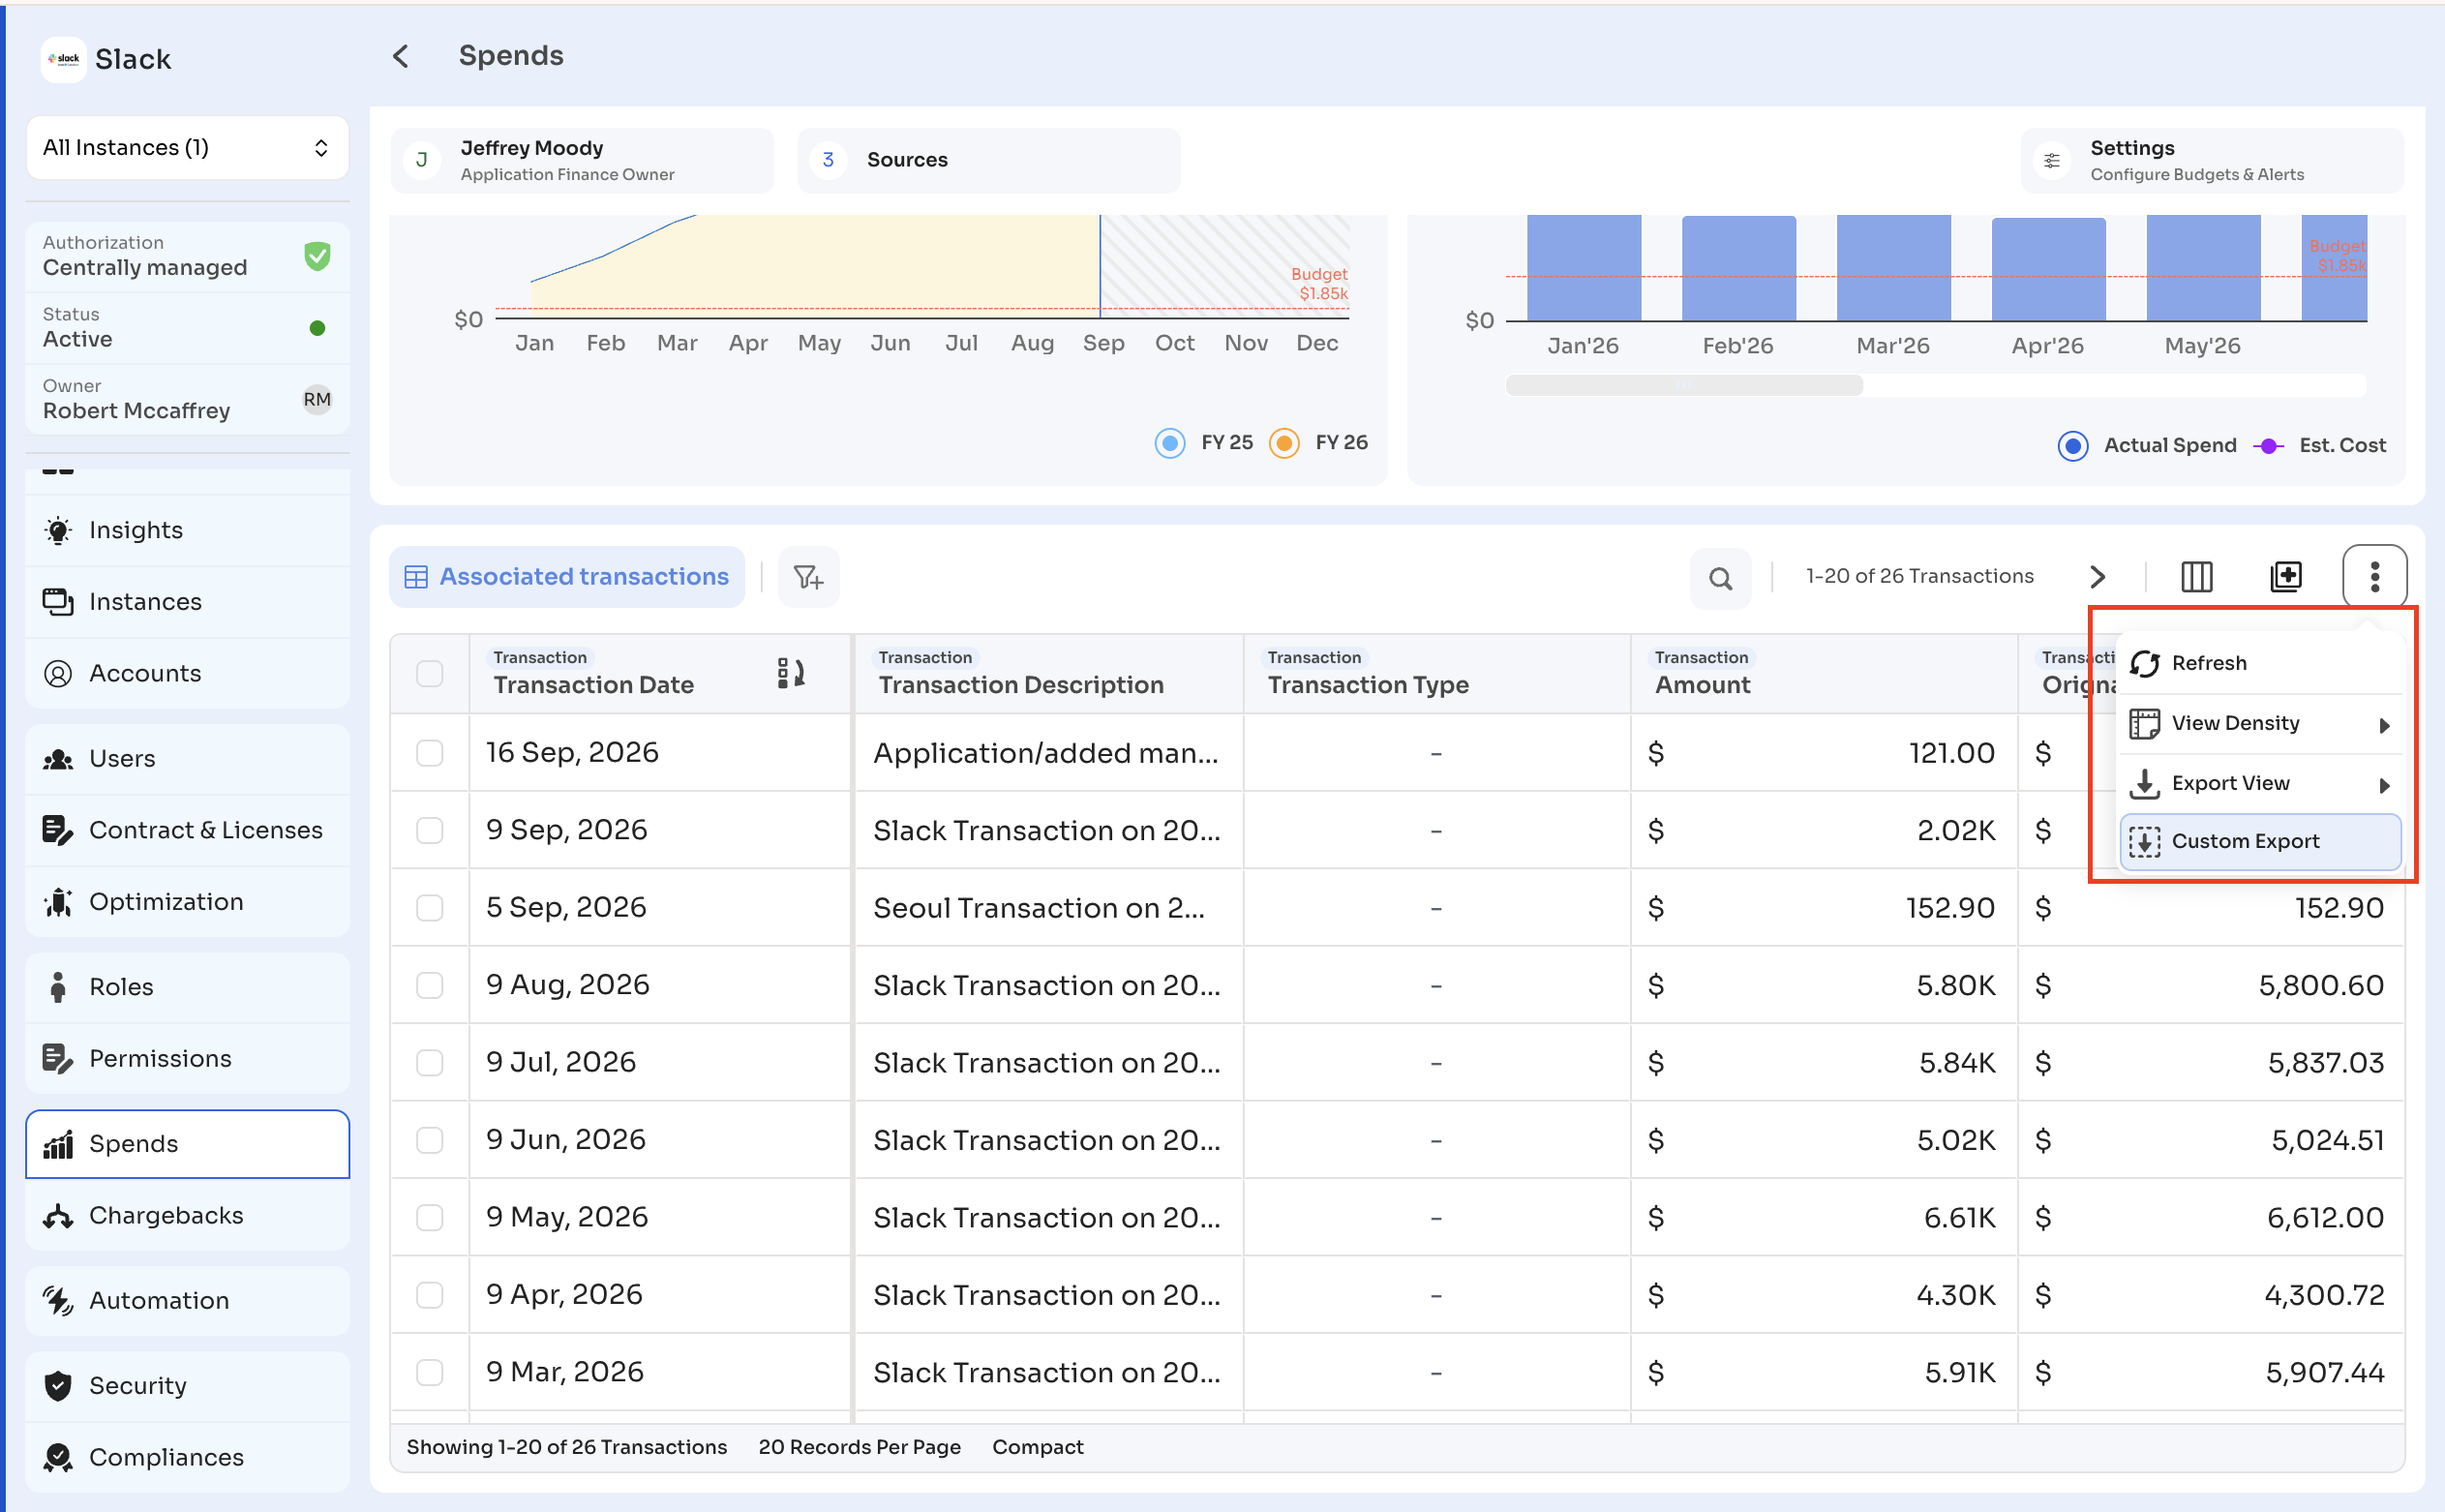
The footer shows the record count and page size, for example Showing 1-20 of 24 Transactions and 20 Records Per Page. Use the arrow next to the record count at the top of the table to go to the next page.
Updated 14 days ago