
Integration health and sync logs
Overview
Integration health shows whether each connected integration is keeping its data current in Zluri. Sync logs record every sync Zluri runs, with its status, stages, and timings.
A connected integration can stop syncing without losing its connection. The Health column on the Connected page flags these integrations, and Sync Logs shows which syncs ran, what data they covered, and where a failed sync stopped. Users who can view the Connected page can view health and sync logs. Users who can act on the Connected page can also reconnect integrations.
What this feature enables
The table below summarizes what integration health and sync logs provide.
| Capability | Description |
|---|---|
| Health for every instance | Each connected instance shows a health state on the Connected page, with the reason on hover. |
| Health for every integration | A collapsed integration row shows its most severe instance state and how many instances need attention. |
| Health filters | Quick filters narrow the Connected page to instances in a specific state. |
| Capabilities | Each instance lists the types of data it collects, such as Activity Information. |
| Reconnect | Instances that can't use their current credentials offer Reconnect from the row menu. |
| Sync Logs | A log of every sync, for all integrations or for a single instance. |
| Sync details | The stages of each sync, its timings, the data it covered, and a copyable Sync ID. |
| Entity details and uploaded files | A per-entity view of each sync for CSV, iPaaS, AI Powered, and SDK integrations, including uploaded CSV files. |
Health states
Each instance on the Connected page shows one of the following health states.
| State | Meaning |
|---|---|
| Errored | Zluri can't use the instance's current credentials, or can't connect to the source. |
| Critical | Scheduled integrations only: no full sync has completed in more than SLA + 48 hours. |
| Degraded | Scheduled integrations: no full sync for SLA + 24 to SLA + 48 hours, or the latest sync failed. Uploaded or pushed integrations: the latest upload or push failed. Any integration: syncs are paused. |
| Initiated | Setup is complete, and the first full sync, upload, or push hasn't finished yet. |
| Healthy | Scheduled integrations: a full sync completed within the last 24 hours and the latest sync didn't fail. Uploaded or pushed integrations: the latest upload or push succeeded. |
| Disconnected | A user disconnected the instance. |
Health updates automatically and recovers on its own after the next successful full sync, upload, or push. Instances whose setup isn't complete don't appear on the Connected page.
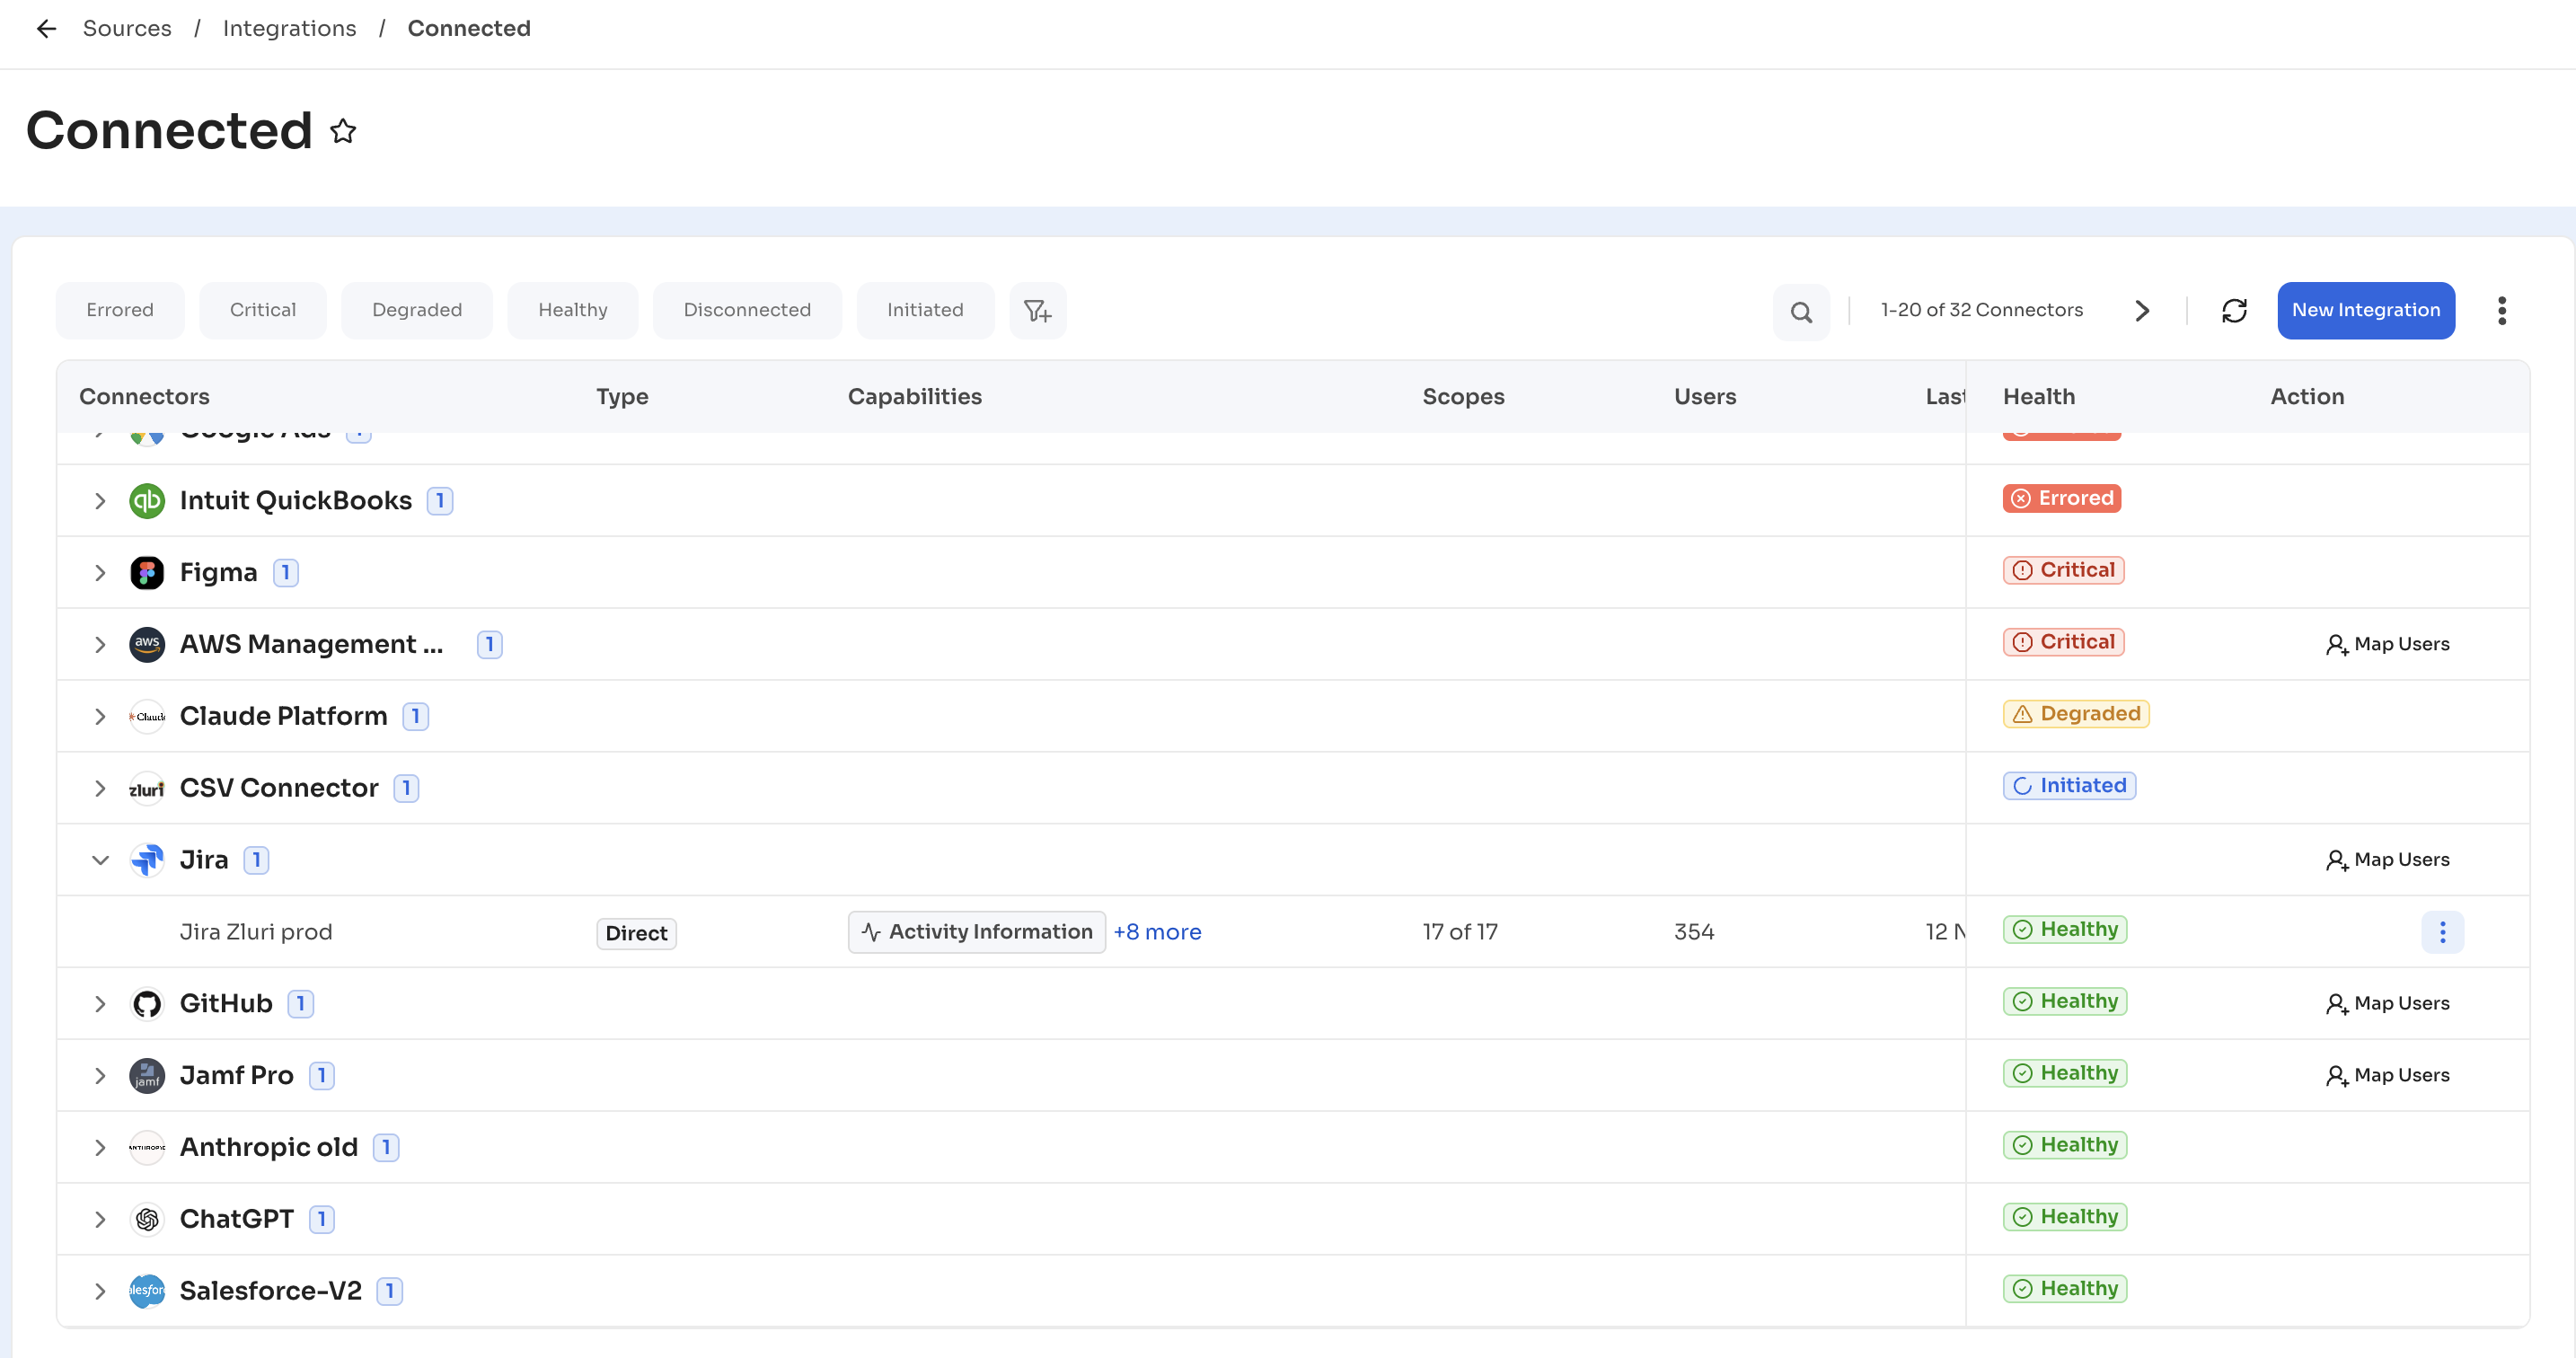
How Zluri calculates health
Zluri judges health in two ways, depending on how an integration gets its data.
| Integration types | How Zluri gets the data | What health is based on |
|---|---|---|
| Direct, JDBC, LDAP, AI Powered, iPaaS | Zluri syncs the data on a schedule. | How long ago the last full sync completed, and whether the latest sync failed. |
| CSV, SDK, Partner | Users upload or push the data to Zluri. | Whether the latest finished upload or push succeeded. There's no time limit. |
For scheduled integrations, the following rules apply.
- A full sync is a scheduled sync that fetched every type of data the integration collects and finished updating Zluri. Users-only syncs don't change health or Last Sync.
- Zluri retries a failed sync automatically, after 45 minutes and again after 90 minutes. Health reflects the failure only after these retries. Credential failures show Errored straight away, without retries.
- A new instance shows Initiated for up to 48 hours while its first full sync runs, and doesn't show Critical in that time.
- Zluri judges each instance only on the types of data its integration collects.
For uploaded or pushed integrations, only the latest finished upload or push counts. A CSV file uploaded once a month stays Healthy as long as the latest upload succeeded. Uploads still in progress don't change health.
When syncs are paused for an instance, an integration, or your organization, the instance shows Degraded, however long the pause lasts.
View integration health
The Connected page lists every connected instance, grouped under its integration. Integrations needing attention appear at the top.
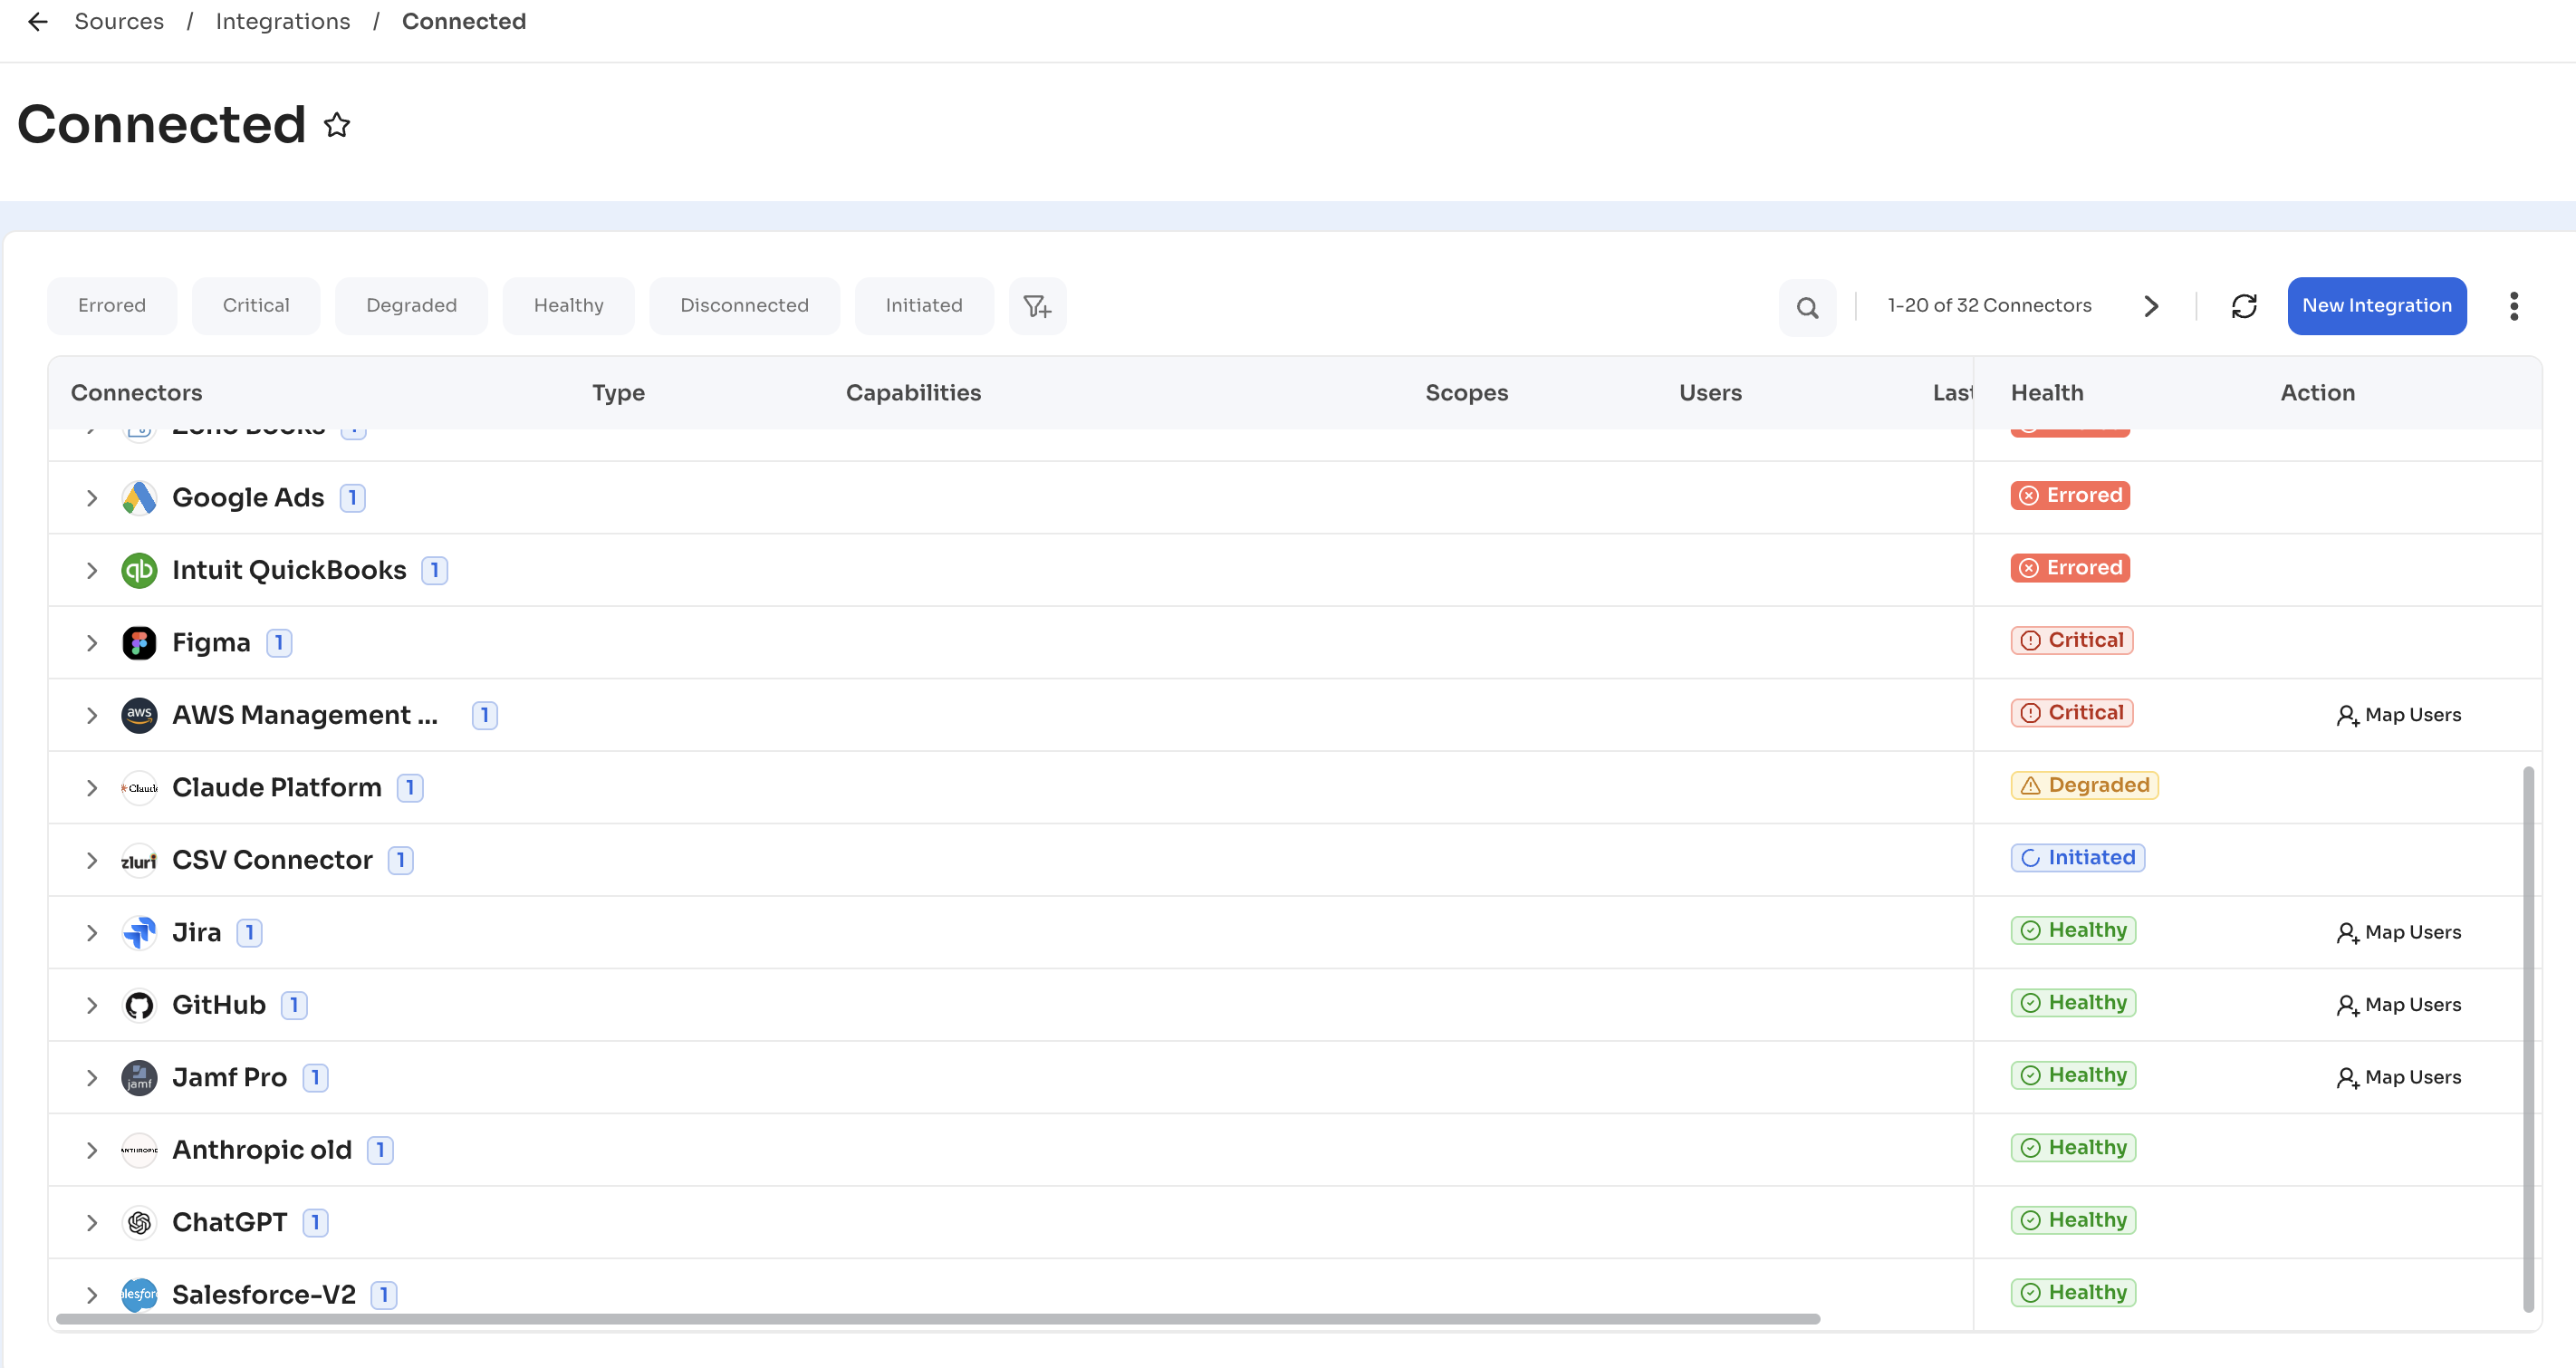
Steps
- Navigate to Sources > Integrations > Connected.
- Hover over the health badge on a collapsed integration to see how many of its instances need attention.
- The integration badge shows the most severe state among its instances, in this order: Errored, Critical, Degraded, Initiated, Healthy, Disconnected. Disconnected instances don't change the integration badge.
- The count includes instances in Degraded, Critical, and Errored.
- Select the arrow next to an integration to expand its instances.
- The Health column stays visible on the right as the table scrolls horizontally.
- Hover over an instance's health badge to see the reason for its state.
- Select a filter chip (Errored, Critical, Degraded, Healthy, Disconnected, or Initiated) to show only instances in that state.
Each instance row shows the following columns.
| Column | Description |
|---|---|
| Type | The integration type, such as Direct or CSV. |
| Capabilities | The types of data the instance collects. |
| Scopes | The number of scopes connected, out of the total available. |
| Users | The number of users Zluri shows for this instance. |
| Last Sync | For scheduled integrations, when the last successful full sync completed. For uploaded or pushed integrations, when the latest upload or push finished. |
| Connected On | When the instance was connected. |
| Connected By | The user who connected the instance. |
| Health | The instance's health state. |
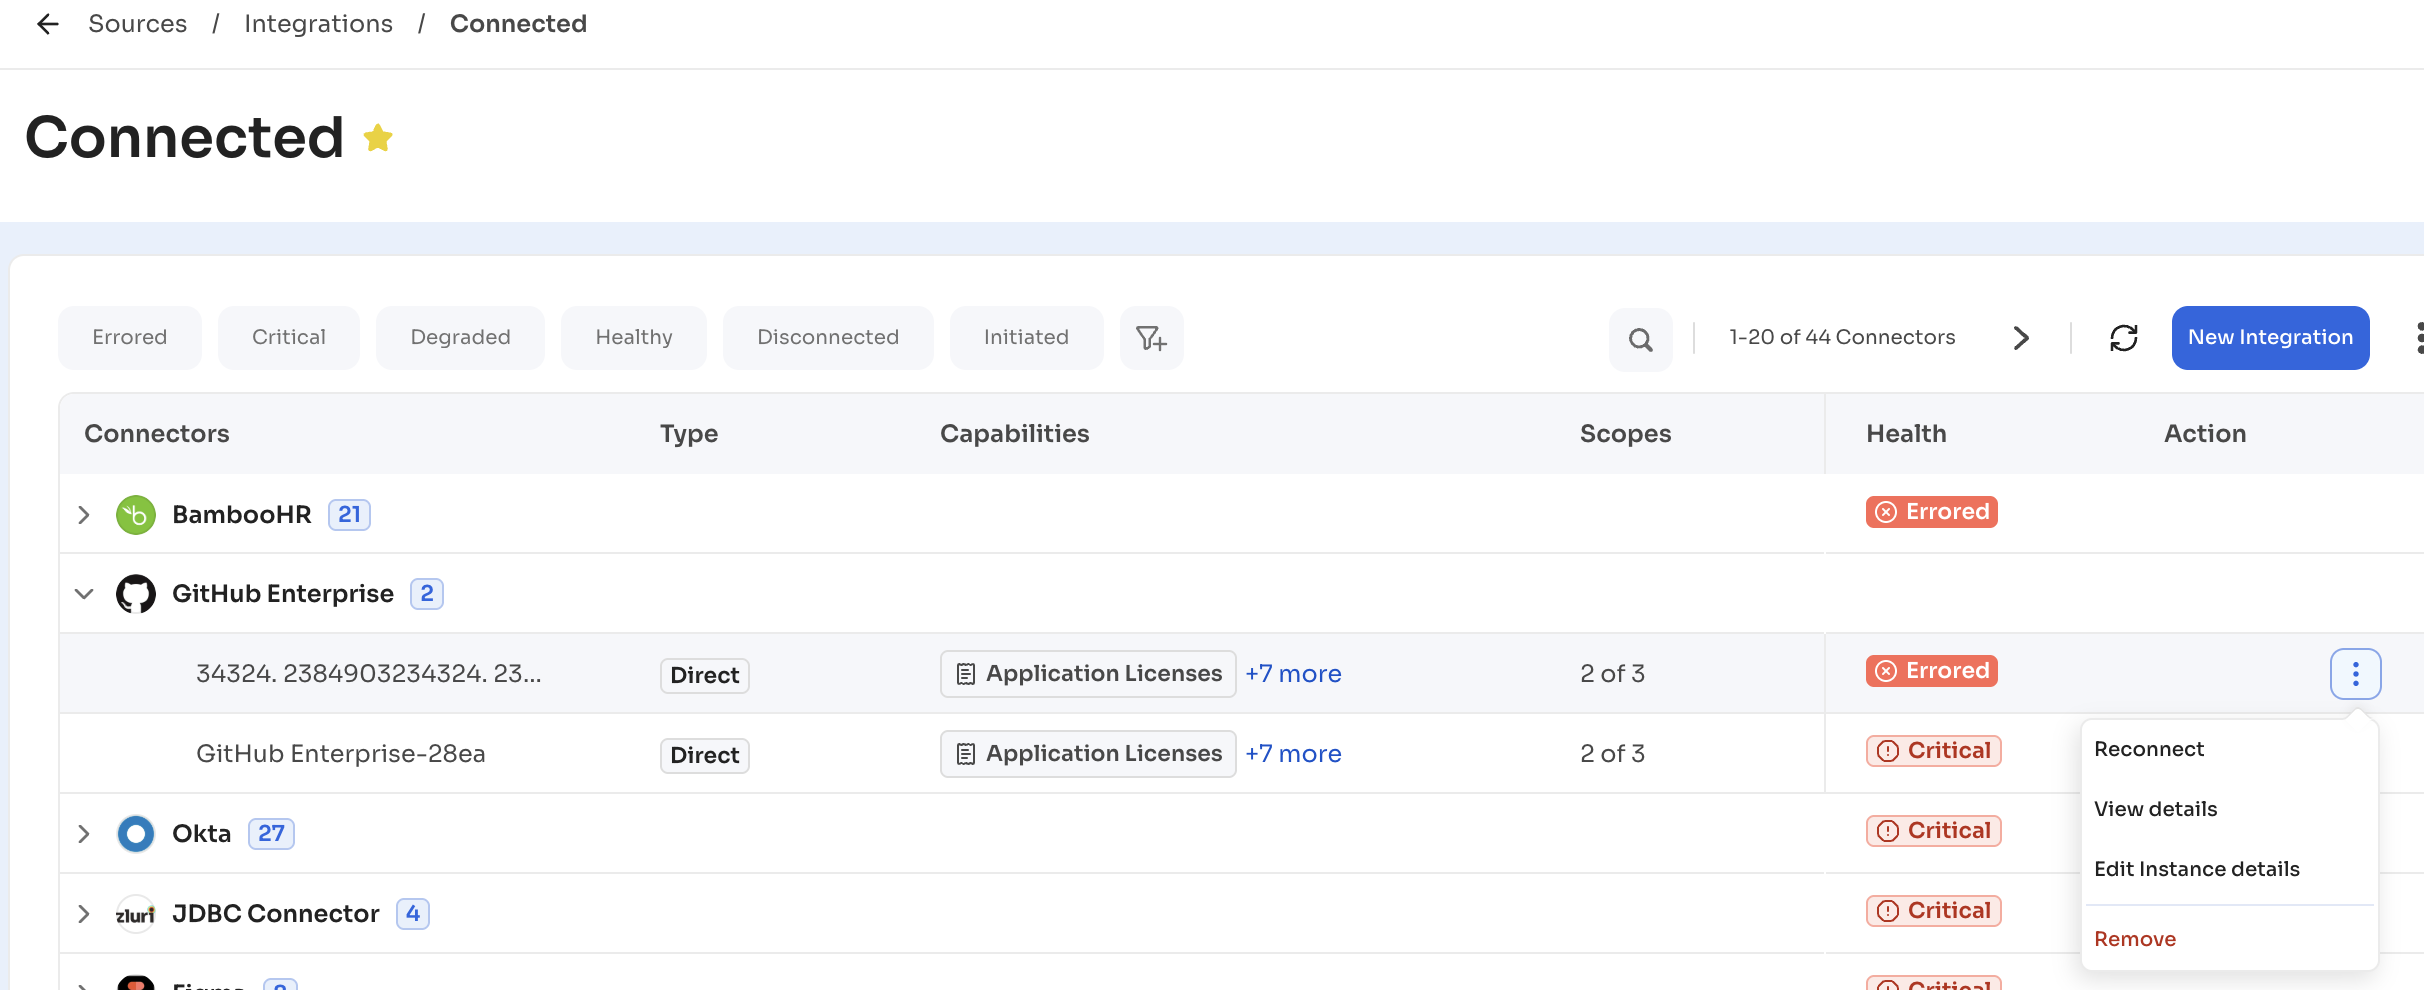
Reconnect an errored integration
An instance shows Errored when Zluri can't use its current credentials. The health badge tooltip reads "Unable to use current credentials. Reconnect this connector with updated credentials."
Steps
-
Navigate to Sources > Integrations > Connected.
-
Select the arrow next to the integration to expand its instances.
-
Select the three-dot menu on the row of the instance marked Errored.
-
Select Reconnect.
-
Complete the connection steps for the integration using the updated credentials.
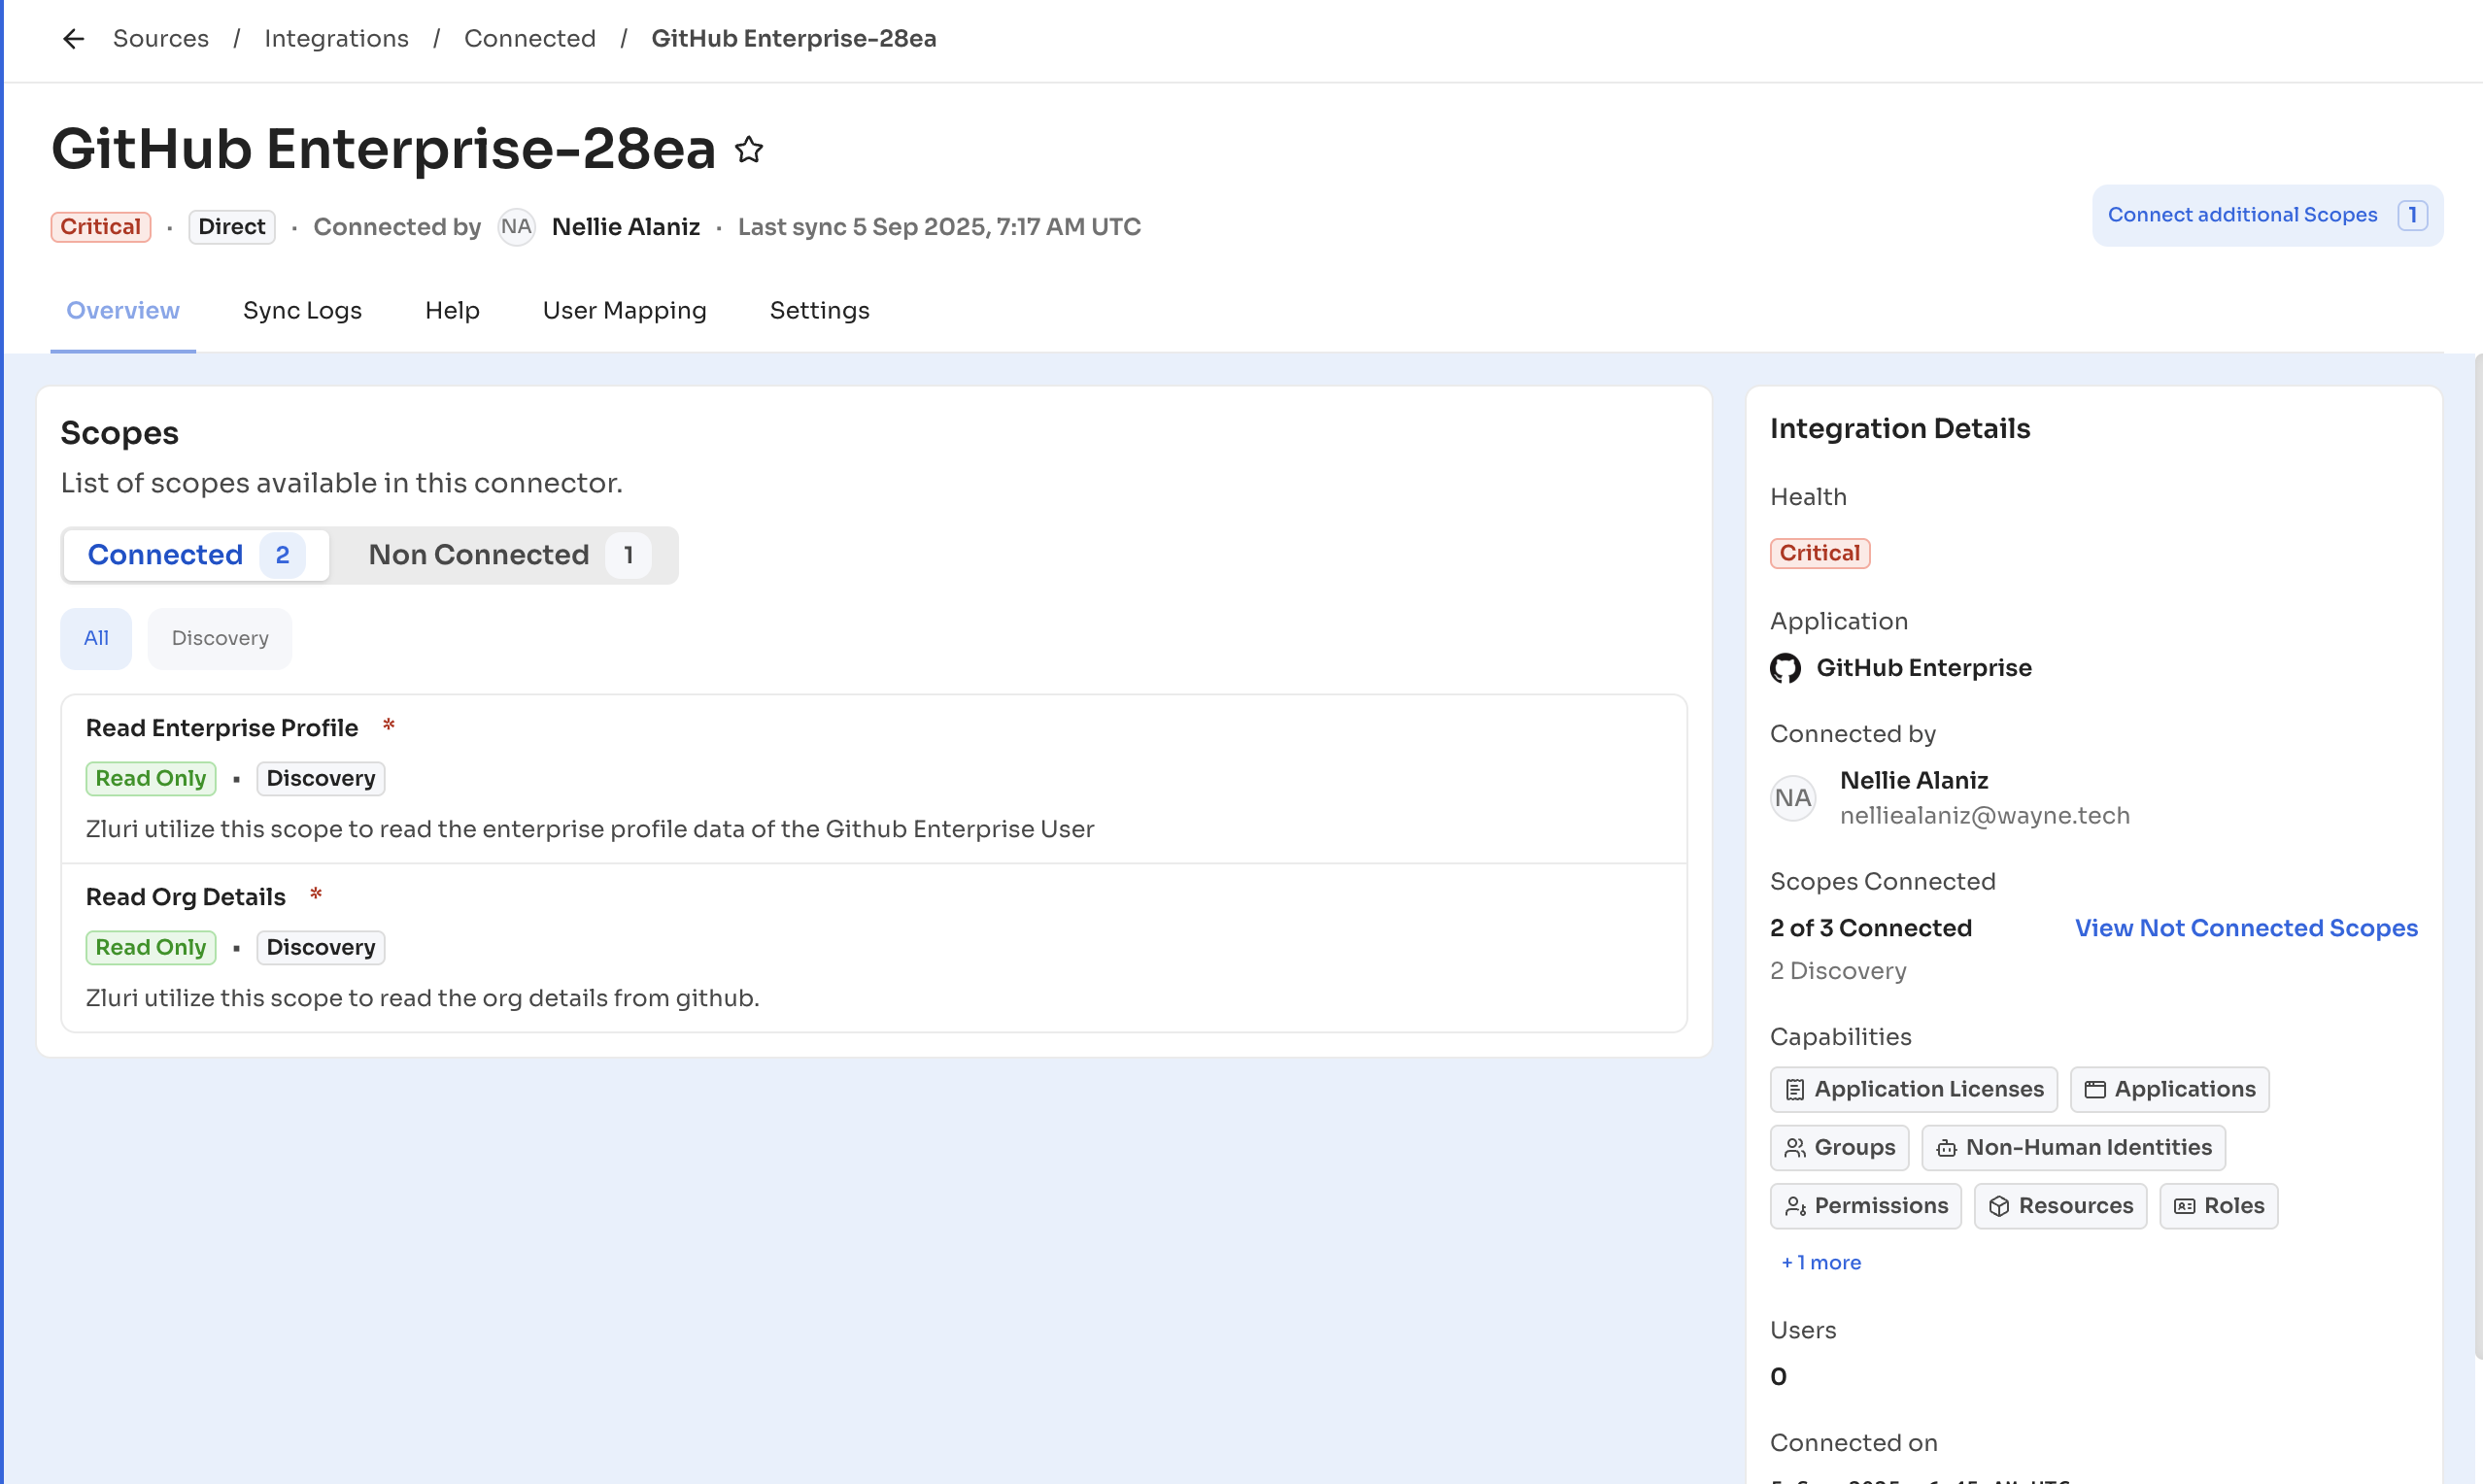
View an instance
Select an instance name on the Connected page to open its page. The header shows the instance name, health, type, who connected it, and Last sync.
The instance page has the following tabs.
| Tab | What it shows |
|---|---|
| Overview | The scopes the instance uses and the Integration Details panel. |
| Sync Logs | The sync history for this instance only. |
| Help | Help for this integration. |
| Settings | Settings for this instance. |
The Integration Details panel shows Health, Application, Connected by, Scopes Connected, Capabilities, Users, Accounts, and Connected on.
View sync logs
Zluri shows sync logs in two places: Sources > Sync Logs for every integration, and the Sync Logs tab on an instance page. Each row is one sync, with the newest first.
Steps
-
Navigate to Sources > Sync Logs.
- To see one instance only, open the instance page and select the Sync Logs tab instead.
-
Select a status chip to show only syncs with that status.
-
Select the filter icon, then select Type to show only syncs from certain integration types.
-
Select the search icon, enter a connector or instance name, and press Enter.
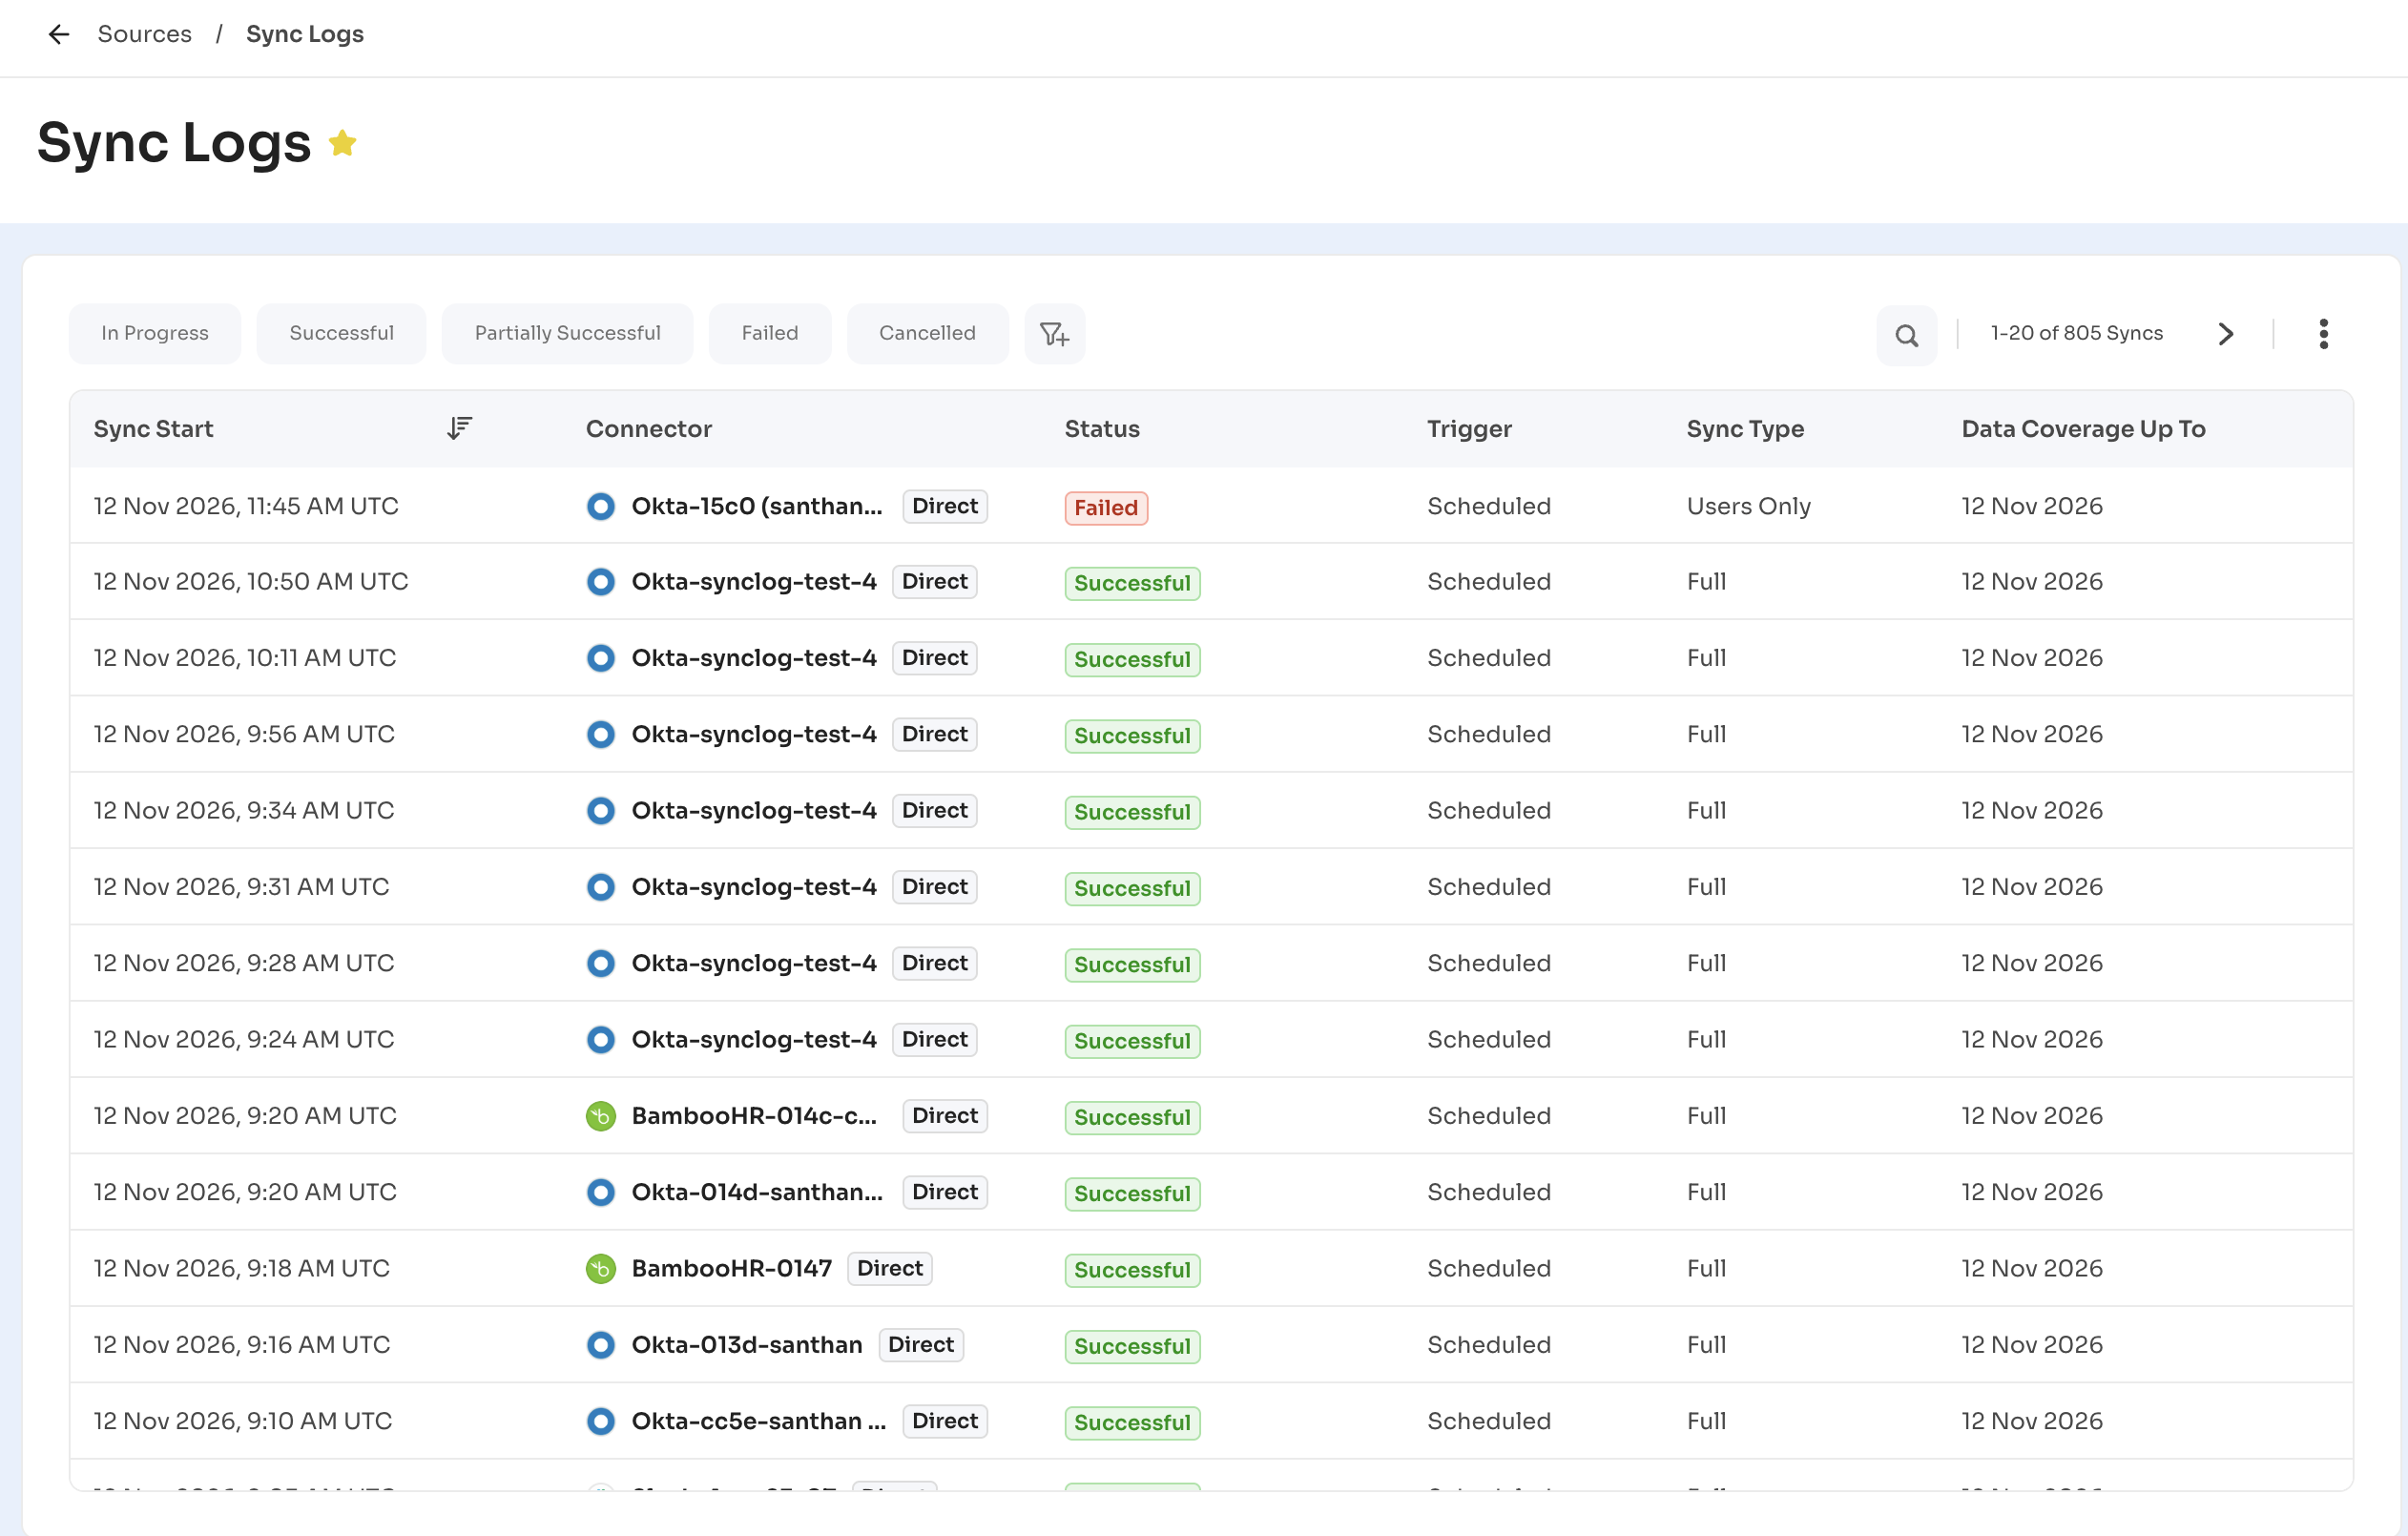
The sync log table includes the following columns.
| Column | Description |
|---|---|
| Sync Start | When the sync started, in UTC. |
| Connector | The instance that ran the sync. This column appears on Sources > Sync Logs only. |
| Status | The outcome of the sync. See the status table below. |
| Trigger | Scheduled for automatic syncs. Manual for CSV uploads, SDK pushes, and partner pushes. |
| Sync Type | The data the sync covered, such as Full or Users Only. |
| Data Coverage Up To | The date up to which the sync fetched new data. |
| Sync Duration | Time from the start of fetching data until Zluri finished updating it. Shows In progress while a sync runs. |
Data Coverage Up To applies to incremental data only. Its tooltip reads "Applies to incremental data only: how far this run fetched new data up to, which is not the same as when it ran."
Each sync has one of the following statuses.
| Status | Meaning |
|---|---|
| In Progress | The sync is still running. |
| Successful | Every stage completed. |
| Partially Successful | The sync completed, but some data didn't sync. |
| Failed | A stage failed. The sync details show which one. |
| Cancelled | The sync stopped before it completed. |
The Type filter includes the following integration types: Direct, CSV, JDBC, AI Powered, SDK, Agent, and Partner.
View sync details
Select any row in Sync Logs to open the sync details panel. The panel title shows the sync start time.
Steps
-
Navigate to Sources > Sync Logs.
-
Select a sync row.
-
Review the stage timeline under Status.
-
Select the copy icon next to Sync ID to copy it.
-
Select the link icon next to the connector at the bottom of the panel to open the instance page.
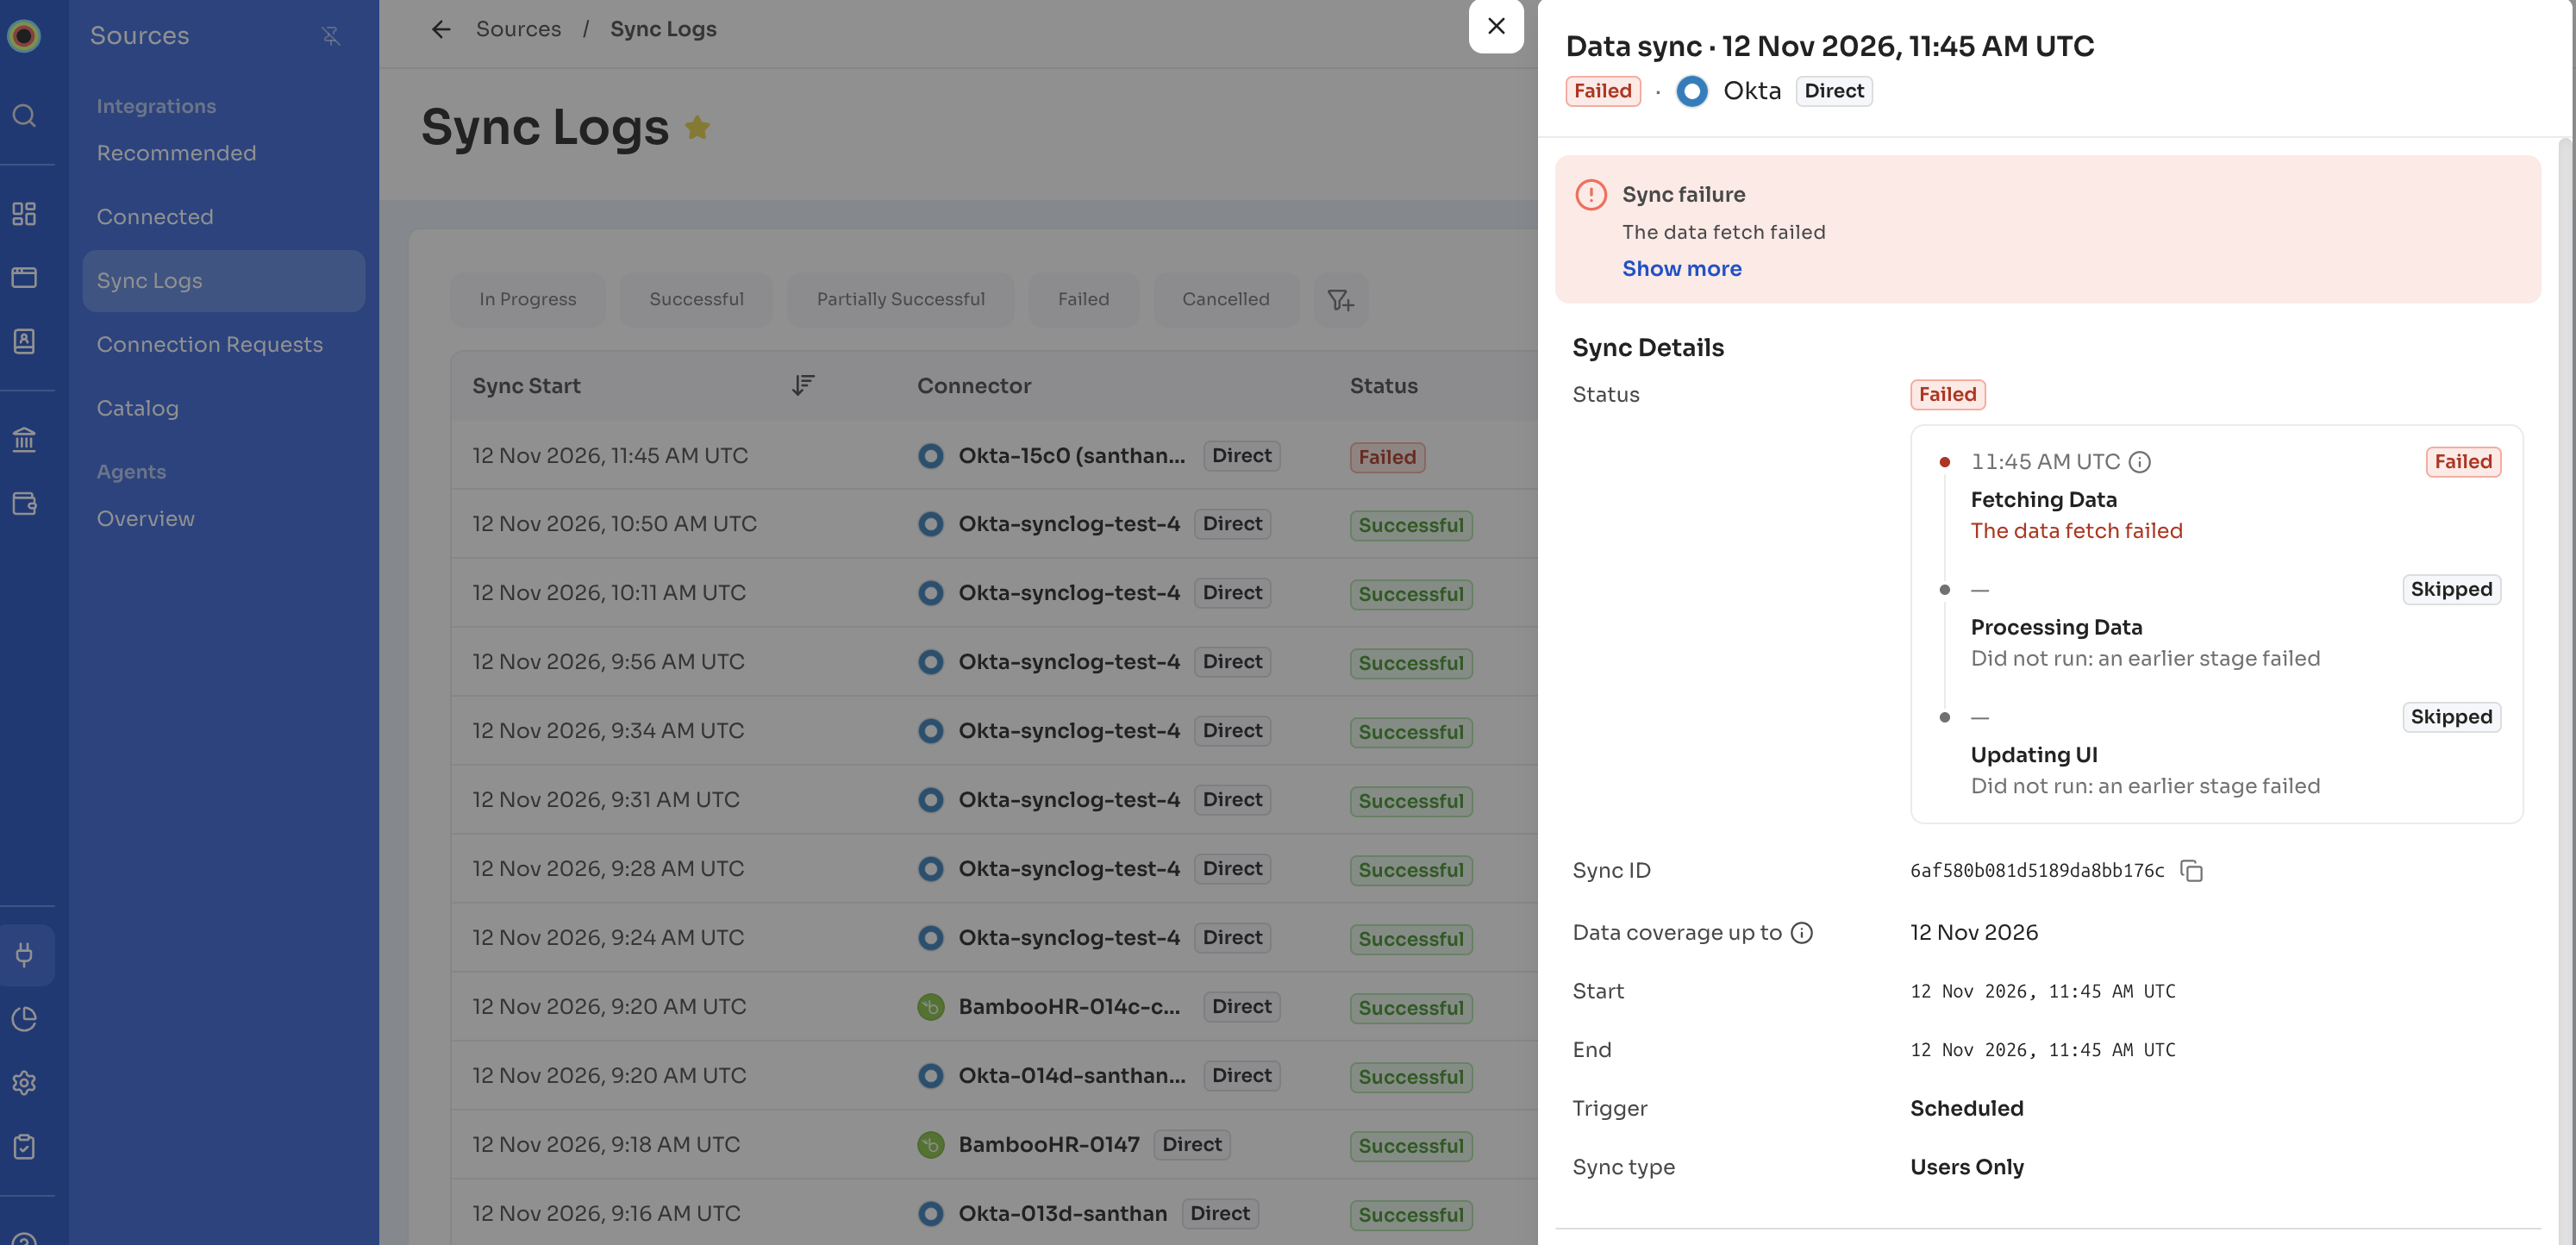
The panel shows the following details for each sync.
| Field | Description |
|---|---|
| Status | The sync status and a timeline of its stages. |
| Sync ID | The unique ID for the sync. Share it with support when a sync fails. |
| Data coverage up to | The date up to which the sync fetched new data. |
| Start | When the sync started, in UTC. |
| End | When the sync ended, in UTC. Shows "-" while the sync is running. |
| Trigger | Scheduled or Manual. |
| Sync type | The data the sync covered. |
| Connector | The integration and its type, with a link to the instance page. |
Every sync passes through the following stages.
| Stage | What happens |
|---|---|
| Fetching Data | Zluri collects data from the source system. |
| Processing Data | Zluri validates, transforms, and reconciles the data. |
| Updating UI | Zluri applies the processed data to the Zluri application. |
Each stage shows In Progress, Successful, Failed, or Skipped, with the time it ran.
View entity details and uploaded files
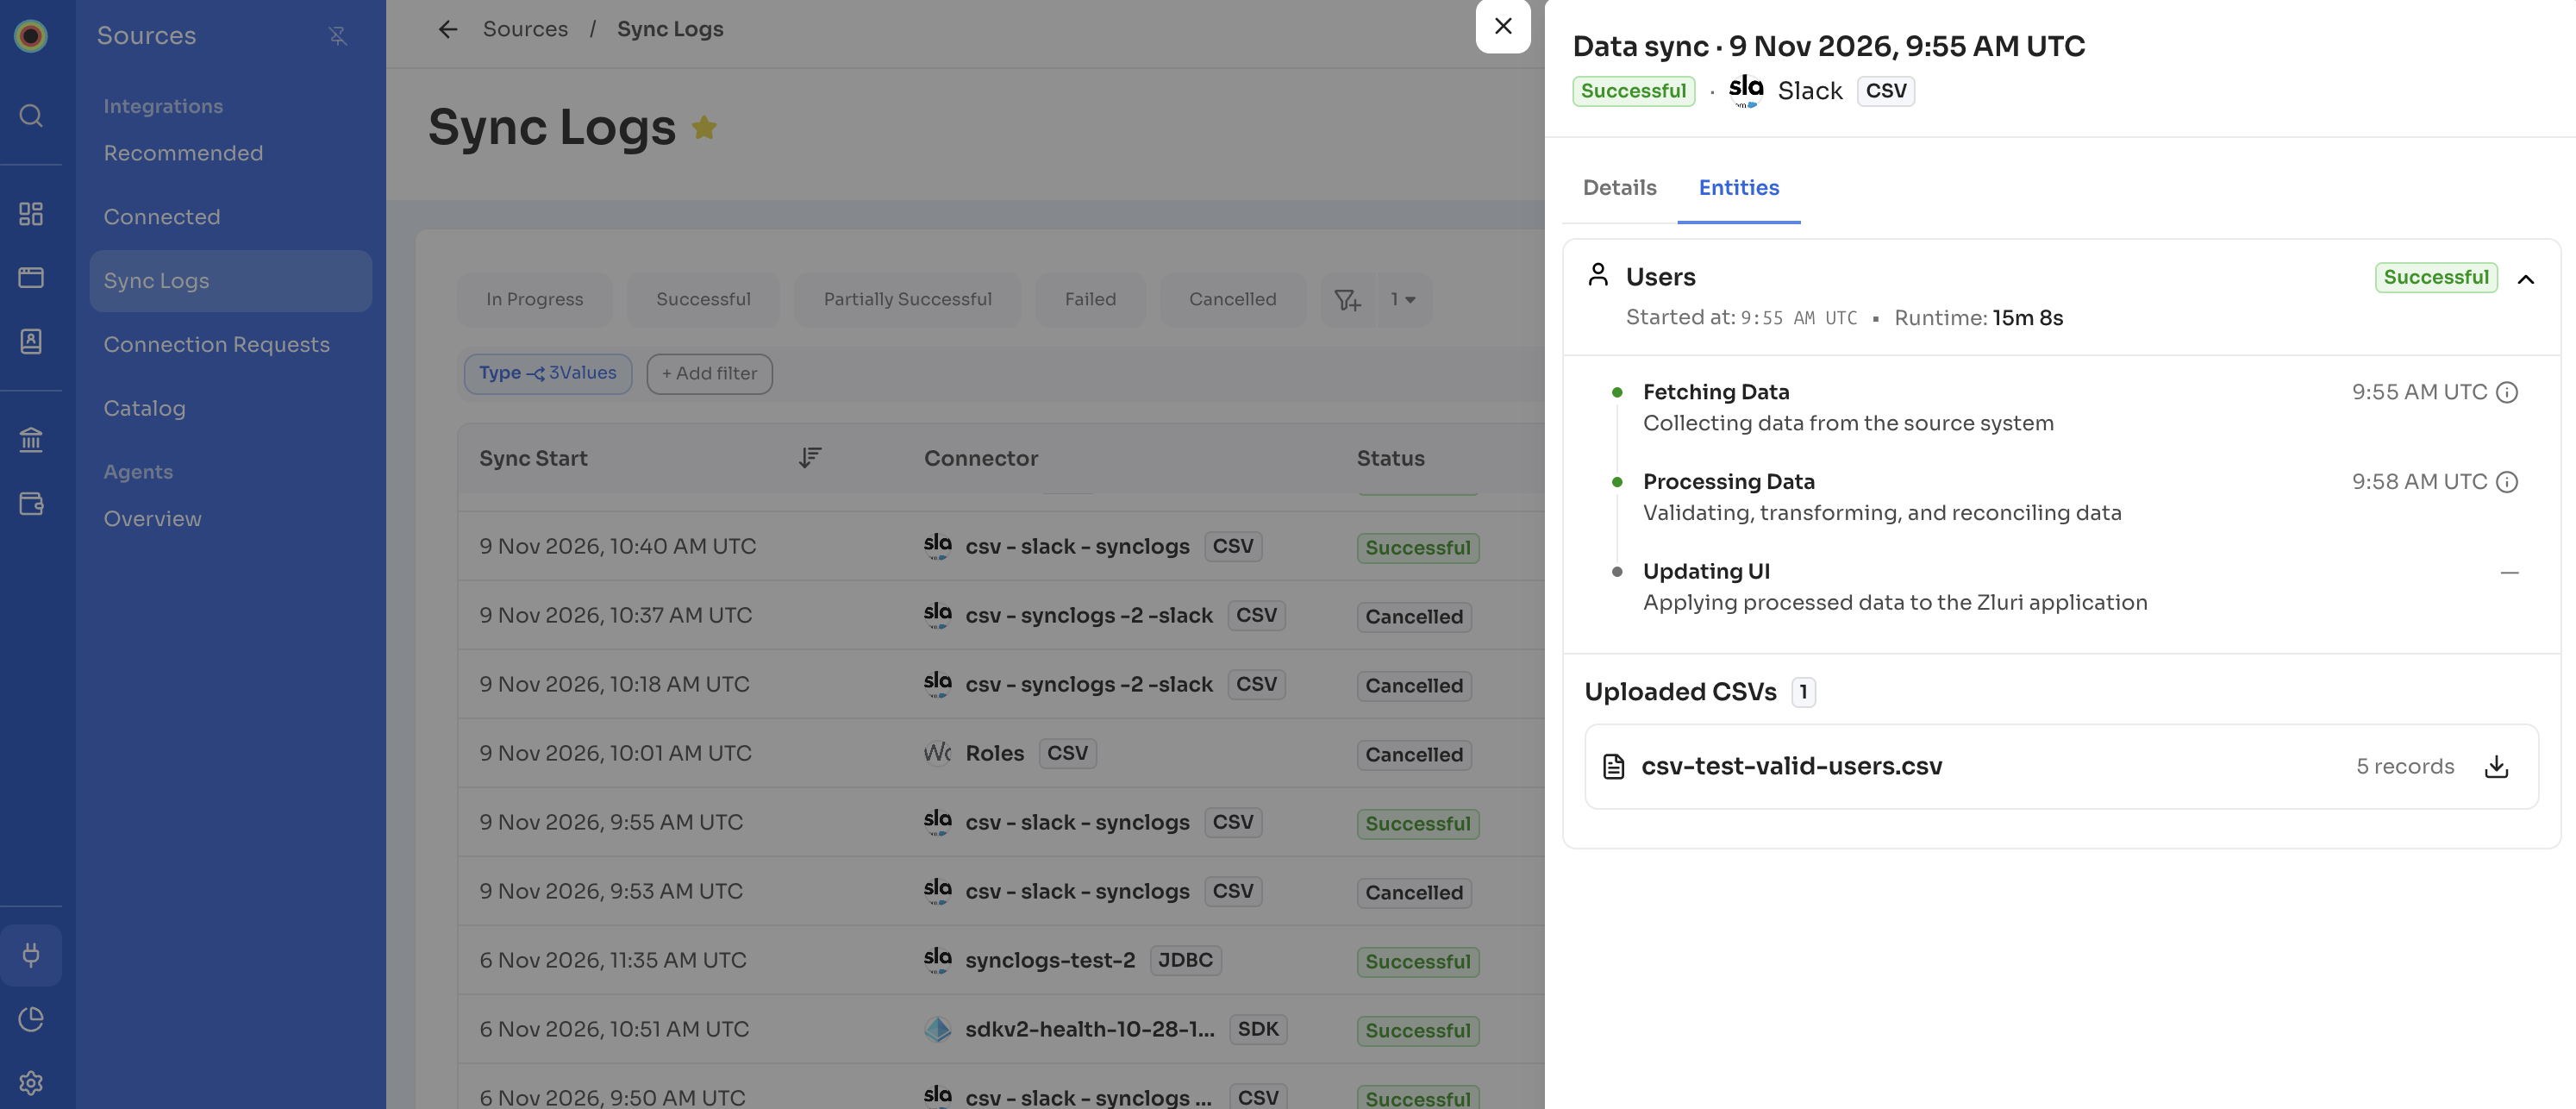
For CSV, SDK, LDAP, JDBC and certain direct integrations, the sync details panel includes an Entities tab. The tab breaks the sync down by entity, such as Users, and lists any uploaded CSV files.
Steps
- Navigate to Sources > Sync Logs.
- Select the Entities tab.
- Select the arrow next to an entity to expand it.
- The expanded entity shows its stages, start time, and runtime.
- Under Uploaded CSVs, select the download icon next to a file to download it.
-
Each file shows its record count, for example 10 records.
-
Messages
The following messages appear in health tooltips and sync details.
| Scenario | What users see |
|---|---|
| Instance can't use its credentials | Health tooltip: "Unable to use current credentials. Reconnect this connector with updated credentials." |
| No full sync for 24 to 48 hours | Health tooltip: "Last full sync overdue by 24-48 hours." |
| No full sync for more than 48 hours | Health tooltip states how long it has been, and what failed if the latest sync failed. For example: "No full sync has completed in more than 48 hours. The latest sync failed: activity data could not be processed." |
| Latest sync, upload, or push failed | Health tooltip states the reason, for example that the latest upload wasn't processed. |
| Syncs paused | Health tooltip states that syncs are paused for your organization, the integration, or the instance. |
| Instance disconnected | Health tooltip: "This connector is disconnected. Reconnect it to resume syncing." |
| Sync failed while processing data | Sync failure alert: "We couldn't process the data from this sync. Share the Sync ID with support." |
| Zluri didn't finish updating the data in time | Stage note under Updating UI: "Refresh did not complete in time" |
| A stage didn't run because an earlier stage failed | Stage note: "Did not run: an earlier stage failed" |
| Zluri has no stage detail for an older sync | Stage note: "Not tracked for this sync" |
Constraints
The following constraints apply to integration health and sync logs.
| Constraint | Description |
|---|---|
| Scheduled integrations | Health and Last Sync reflect full syncs only. Users-only syncs don't change them. |
| Uploaded or pushed integrations | Health reflects the latest finished upload or push only, with no time limit. |
| Paused syncs | A paused instance shows Degraded for as long as the pause lasts. |
| Entity details | The Entities tab appears for CSV, LDAP, JDBC select direct integrations, and SDK integrations only. Other integrations show the stage timeline for the whole sync. |
| History | Sync Logs includes three months of history from before the feature launched, and keeps all syncs from launch onward. |
| Time zone | All times show in UTC. |
Updated less than a minute ago