
Dashboard
Dashboards in Zluri give you real-time visual insights into your organization's identity, access, and SaaS operations. Each dashboard is made up of widgets that display key metrics as charts or tables, so you can monitor performance, risks, and trends across the Identity Governance and Administration (IGA) and SaaS Management Platform (SMP) modules.
Example: The Access Requests Dashboard includes widgets such as Total Access Requests Raised, Requests Pending Fulfillment, and Approval Bottlenecks.
Prerequisites
To create or edit dashboards, you must be a Zluri user with Analytics permission. Access depends on:
- Ownership: You can edit only dashboards you own.
- Visibility Settings: You can view dashboards shared with you.
- Dataset Access: You can access a dashboard only if you have access to at least one dataset it uses.
Dashboard library
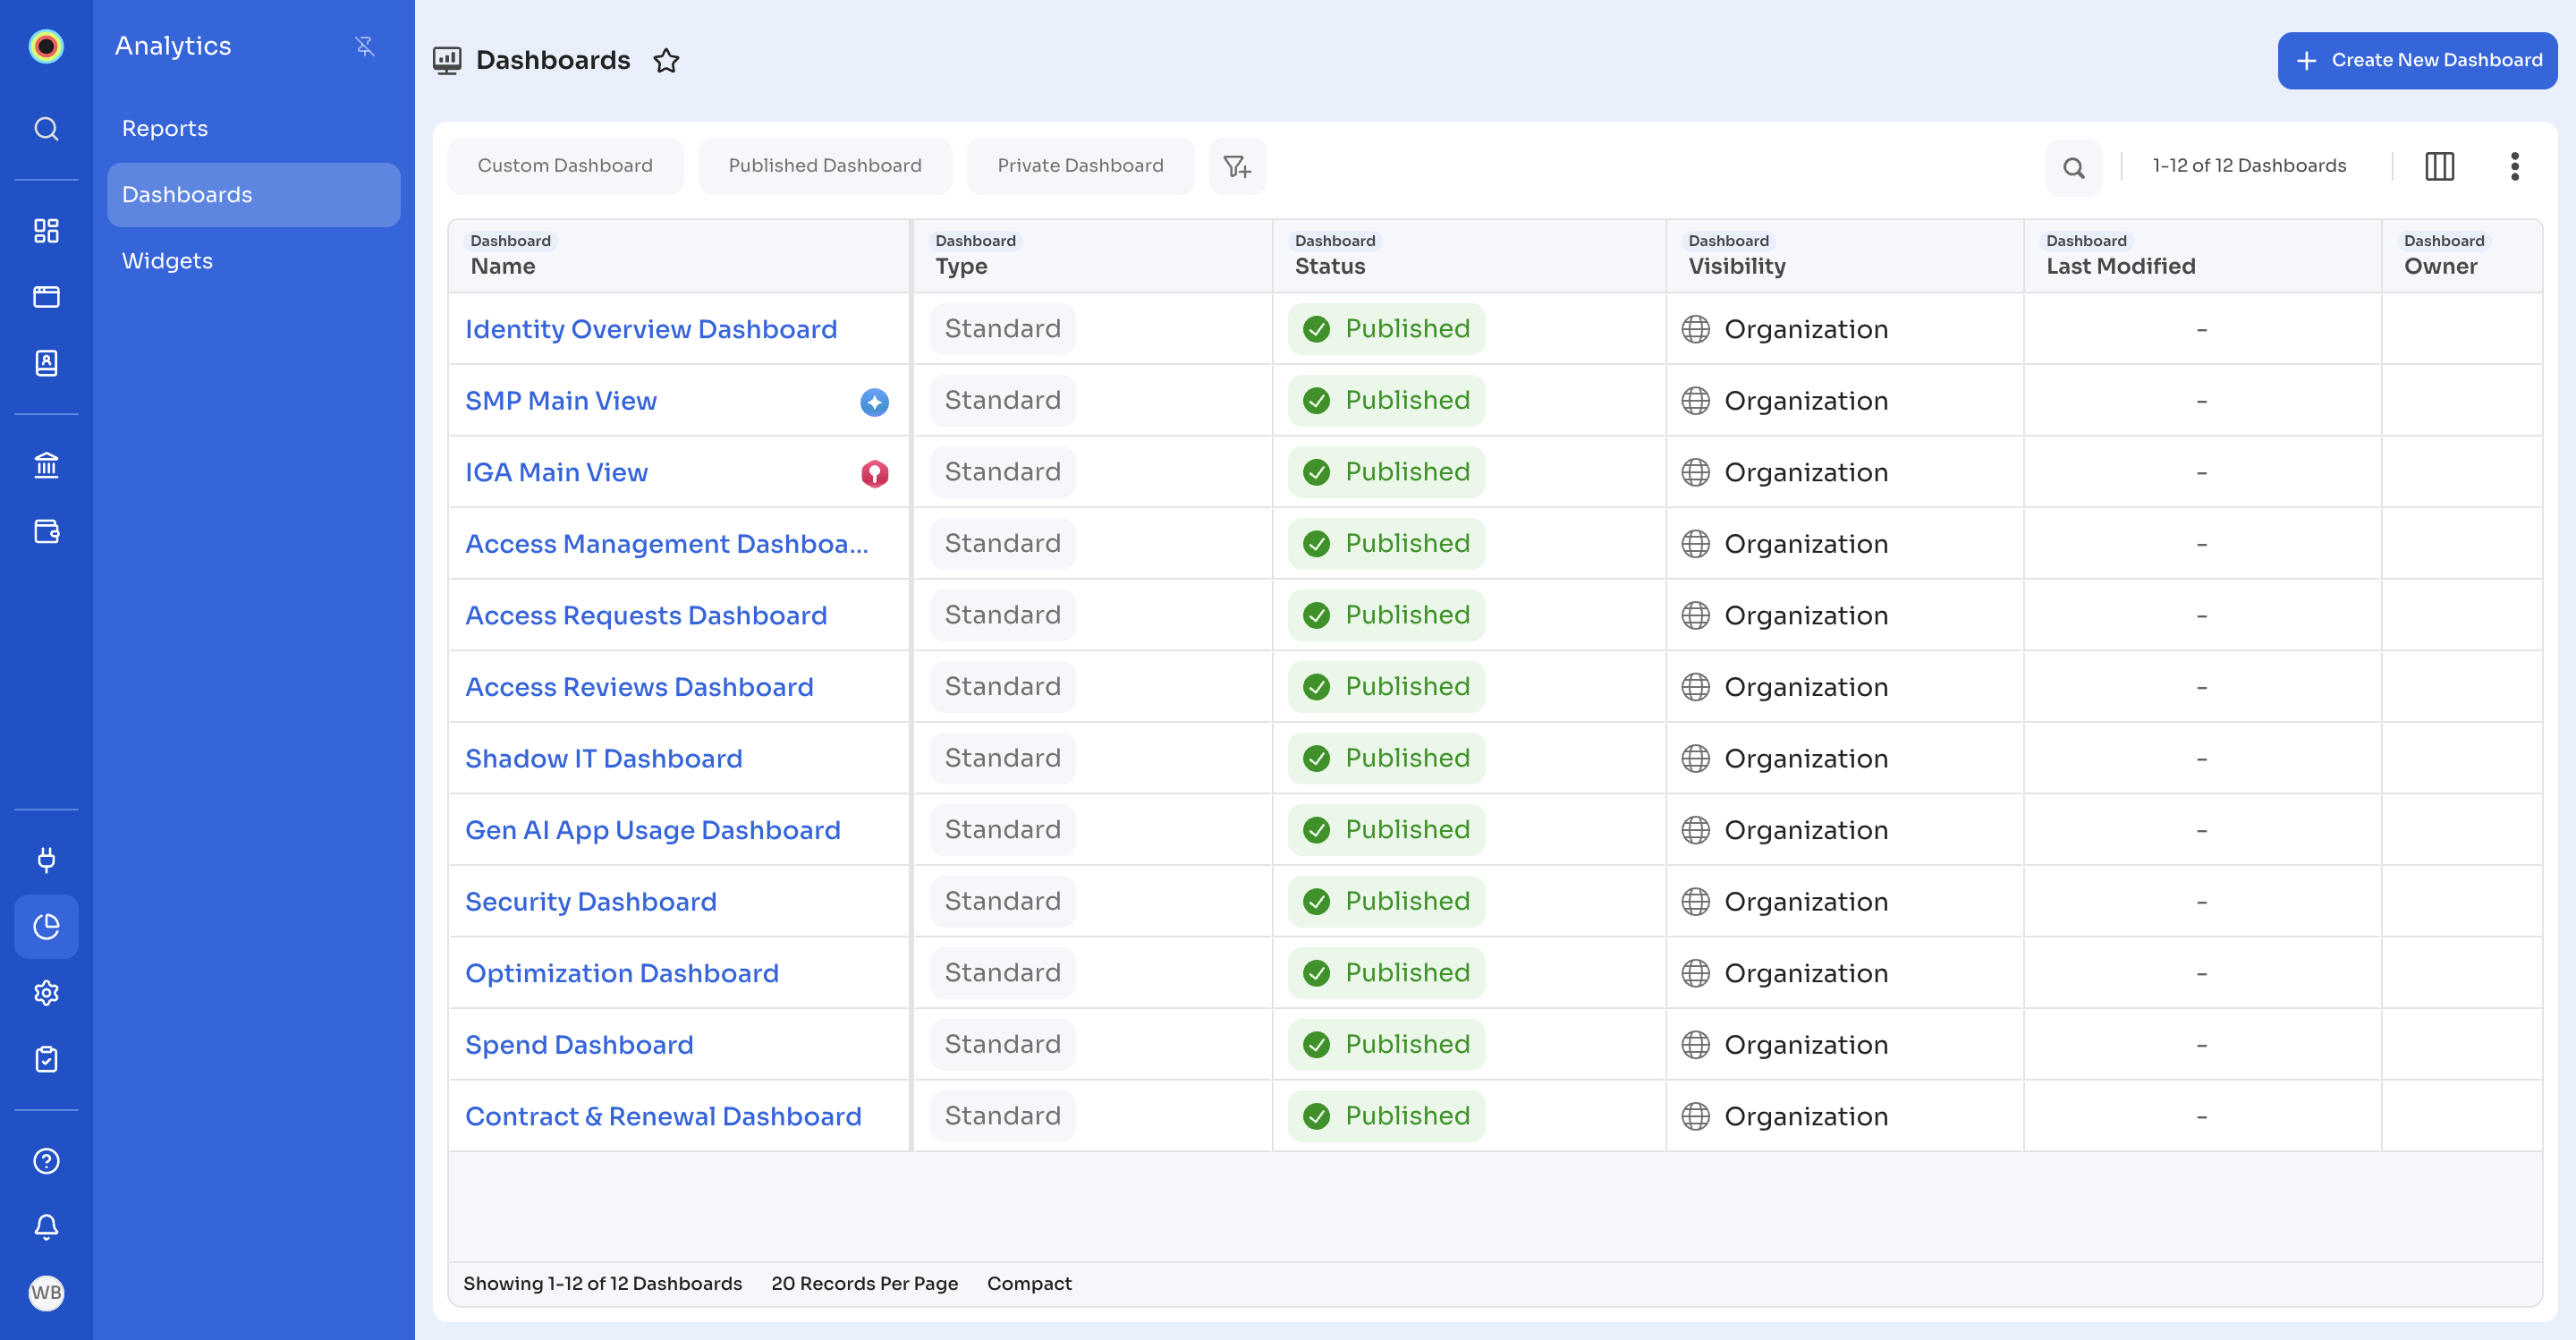
The Dashboards page lists all dashboards available to you, whether you own them or they're shared with you.
On the Dashboards page, you can:
- View the dashboards you have access to, with their Name, Type, Status, Visibility, Last Modified, and Owner.
- Use the quick filters Custom Dashboard, Published Dashboard, and Private Dashboard.
- Search dashboards by name.
- Open the Actions menu (⋮) on a dashboard row: Edit, Duplicate, Change Dashboard Visibility, Set As Overview (see Setting a Dashboard for Overview in Zluri), Download, Schedule Email Reports, and Delete.
Pre-built dashboards
Zluri includes 12 pre-built dashboards. On the Dashboards page, they have the type Standard, the status Published, and the visibility Organization.
| Dashboard | What it shows |
|---|---|
| Identity Overview Dashboard | Human and non-human identities (NHIs), privileged identities, orphaned NHIs, and secrets that expire soon or never expire. |
| SMP Main View | Managed applications, active employees, upcoming contract renewals, unused and undeprovisioned licenses, and spend by month. |
| IGA Main View | Access requests, completed access certifications, orphaned and dormant accounts, and onboarding and offboarding workflow success rates. |
| Access Management Dashboard | Onboarding and offboarding workflows run, their success rates, and how they trend over time. |
| Access Requests Dashboard | Access requests that are raised, fulfilled, rejected, and pending fulfillment, plus approval bottlenecks and the most requested apps. |
| Access Reviews Dashboard | Ongoing, completed, and upcoming access certifications, remediation status, and access revoked or modified after reviews. |
| Shadow IT Dashboard | Shadow and restricted applications, including AI applications, recently discovered or used, and top shadow apps by user count. |
| Gen AI App Usage Dashboard | Managed, unmanaged, needs-review, and restricted AI applications, user counts per AI app, and recently discovered or used AI apps. |
| Security Dashboard | Restricted applications and AI applications and their recent use, plus external and orphaned accounts per managed app. |
| Optimization Dashboard | Unused and undeprovisioned licenses, savings under review, and estimated realized savings. |
| Spend Dashboard | Spend and estimated cost for the last 12 months, top applications by spend, and spend by department and cost center against budget. |
| Contract & Renewal Dashboard | Active and expired contracts, active subscriptions, and upcoming contract renewals. |
To customize a pre-built dashboard, open its Actions menu (⋮), click Duplicate, and edit the copy. For Standard dashboards, Edit, Change Dashboard Visibility, and Delete are greyed out.
Open a dashboard
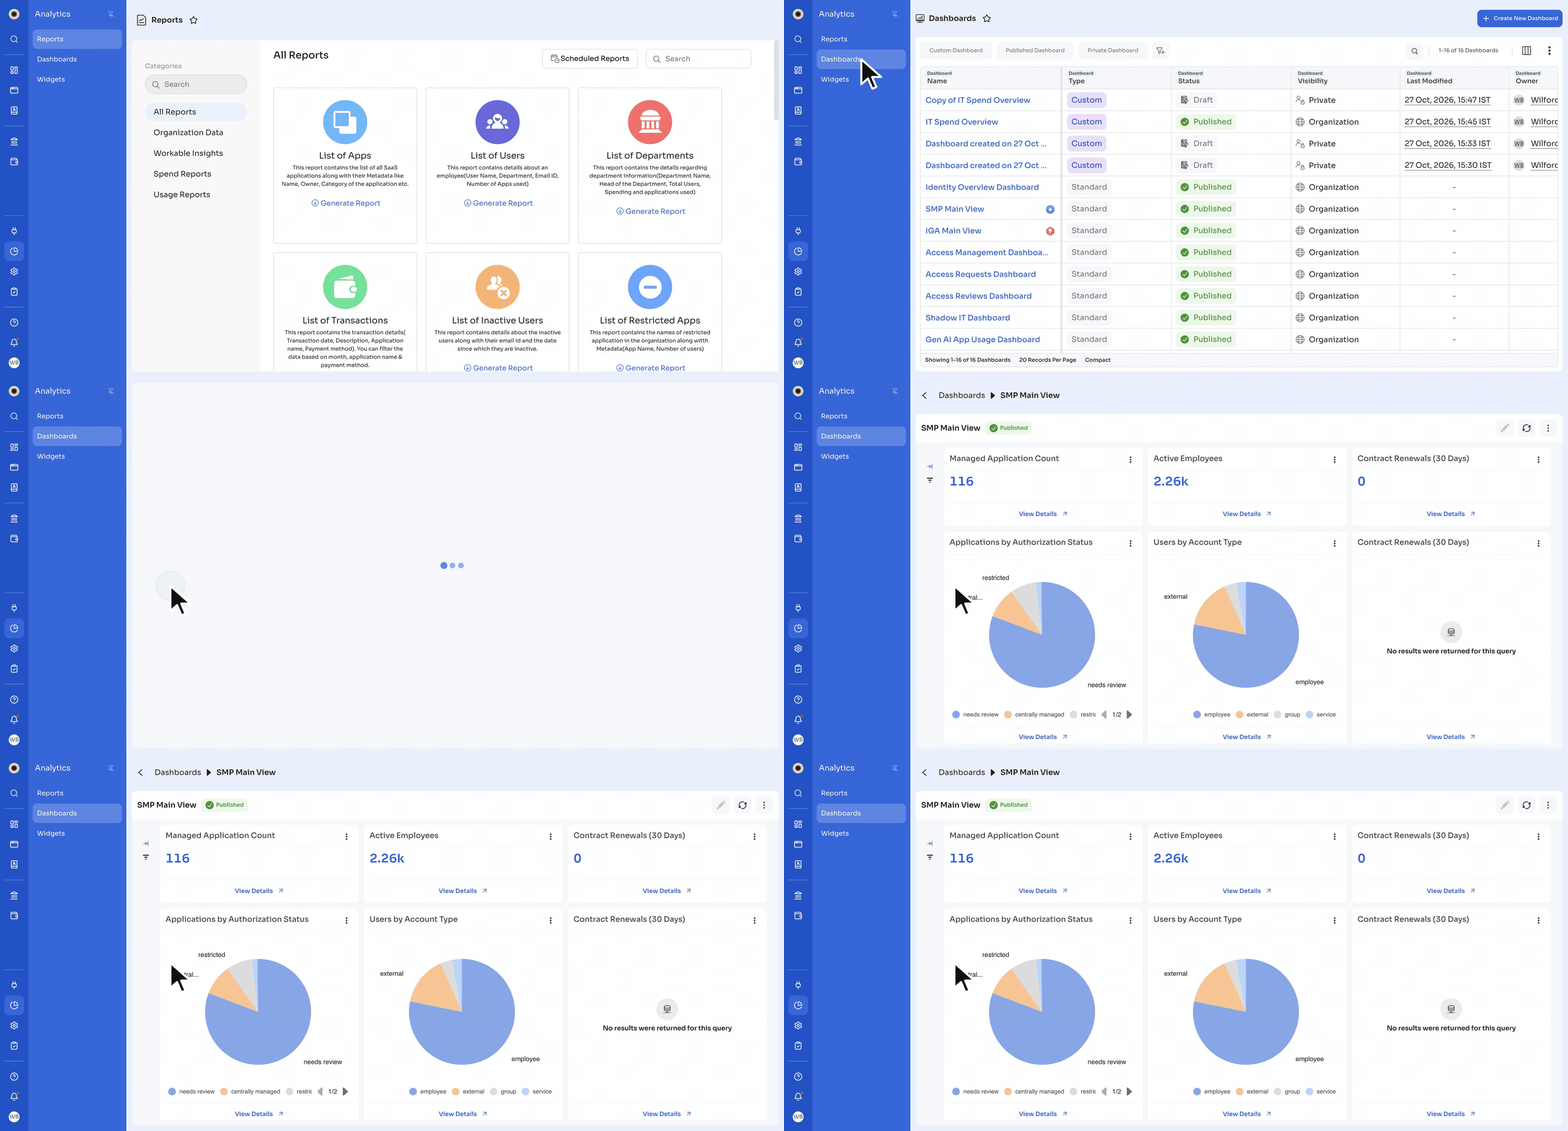
- Go to Analytics → Dashboards.
- Click a dashboard name to open it and view its widgets.
Create a dashboard
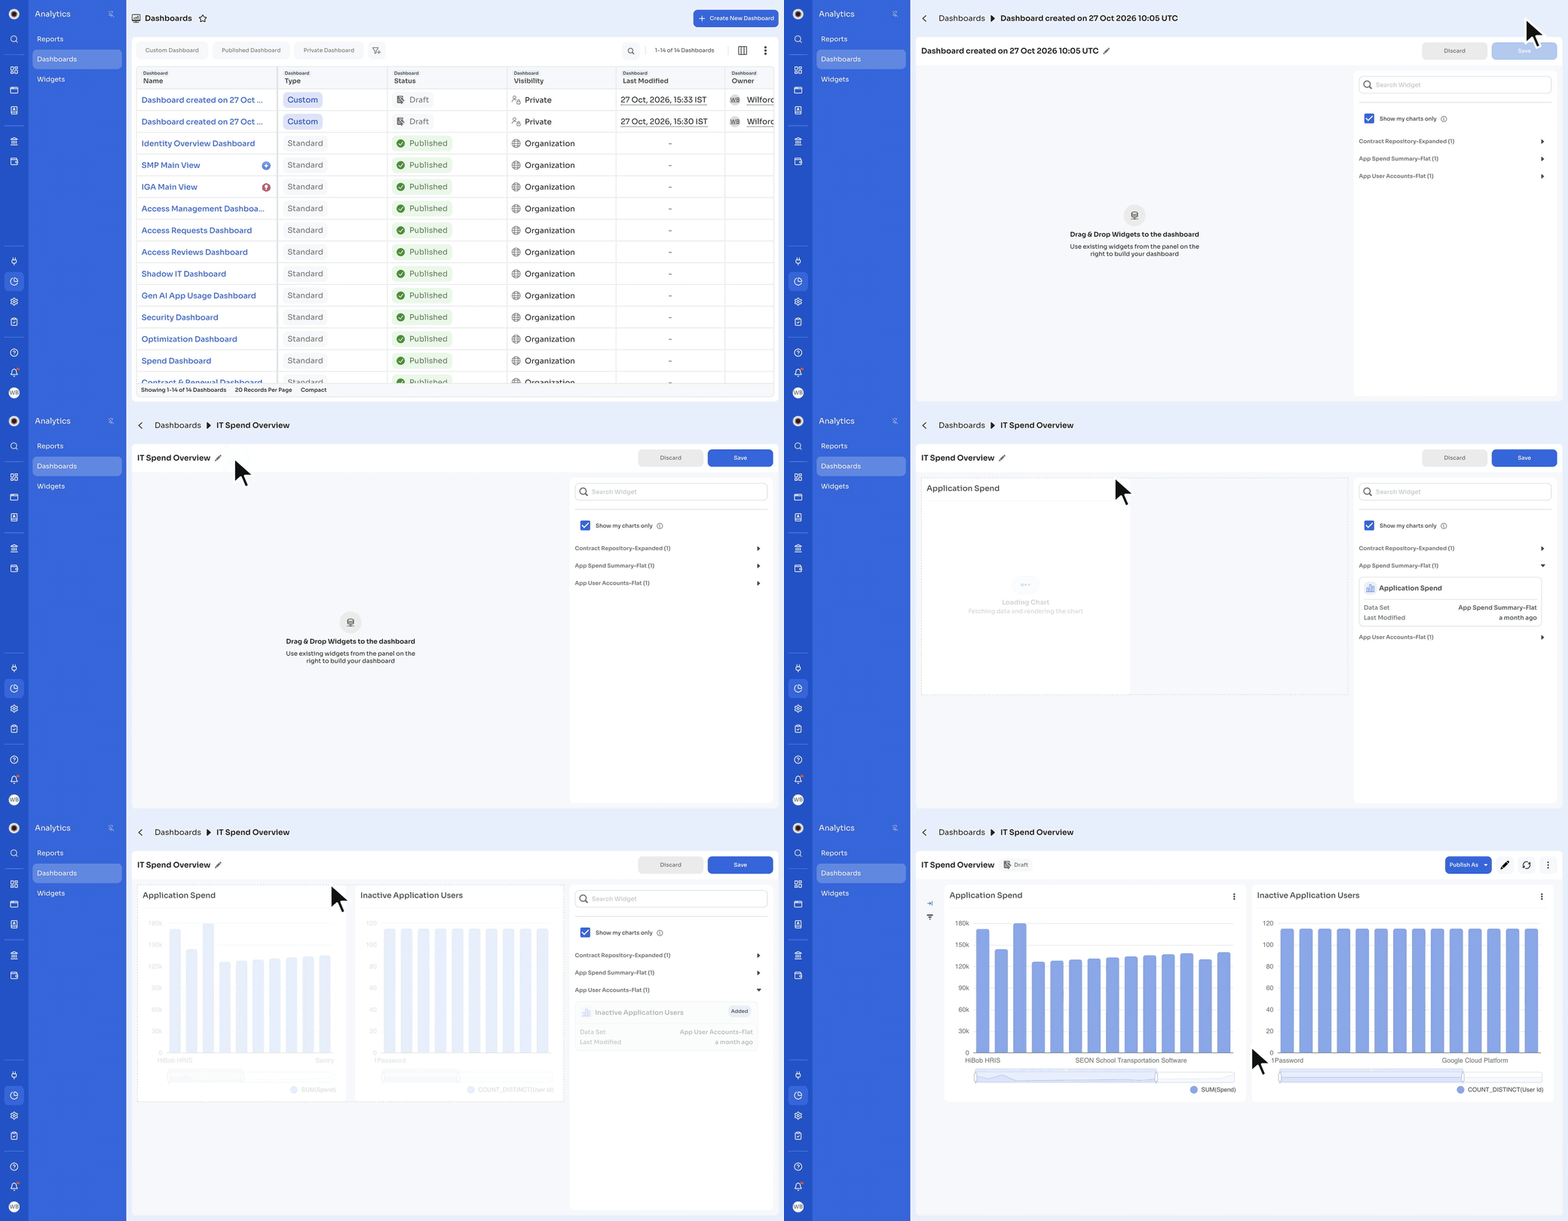
- Go to Analytics → Dashboards and click Create New Dashboard.
- The dashboard editor opens with a default name, such as Dashboard created on 27 Oct 2026 10:05 UTC. To rename it, click the edit icon next to the name, type the new name, and click the check mark.
- In the panel on the right, find widgets by expanding a dataset group or by using Search Widget. Show my charts only is selected by default. Clear it to see all widgets you can use.
- Drag widgets from the panel onto the dashboard.
- Click Save. In Are you sure you want to save the changes?, click Save again.
Zluri shows This dashboard was saved successfully. The new dashboard is in Draft status until you publish it. See Publish a dashboard.
Edit a dashboard
- Go to Analytics → Dashboards.
- Find the dashboard you want to edit in the list.
- Click the Actions menu (⋮) next to the dashboard and select Edit.
Note: Only the dashboard owner can use the Edit option.
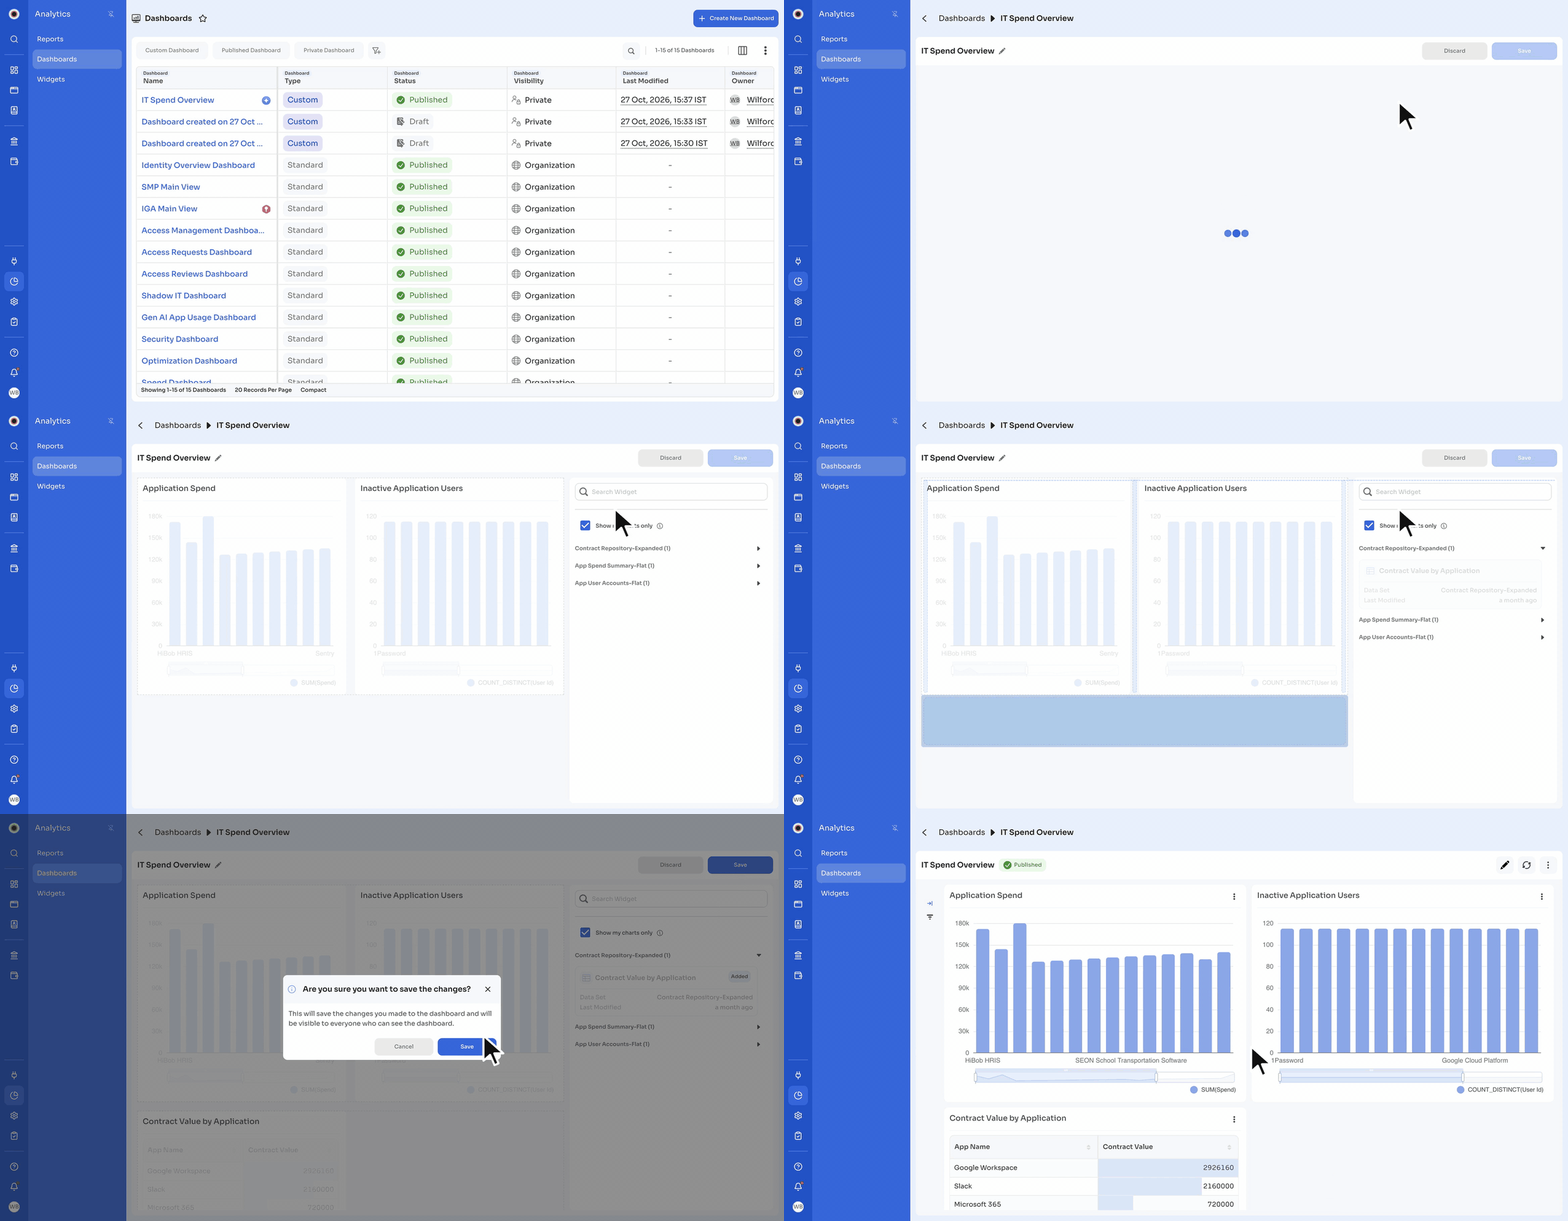
- In the dashboard editor, you can:
- Rearrange existing widgets
- Add new widgets from the panel on the right
- Remove widgets you no longer need
- Rename the dashboard
- Click Save, then Save again to confirm. To leave without keeping your changes, click Discard.
If the dashboard is published, your changes are visible to everyone who can see it as soon as you save.
Duplicate a dashboard
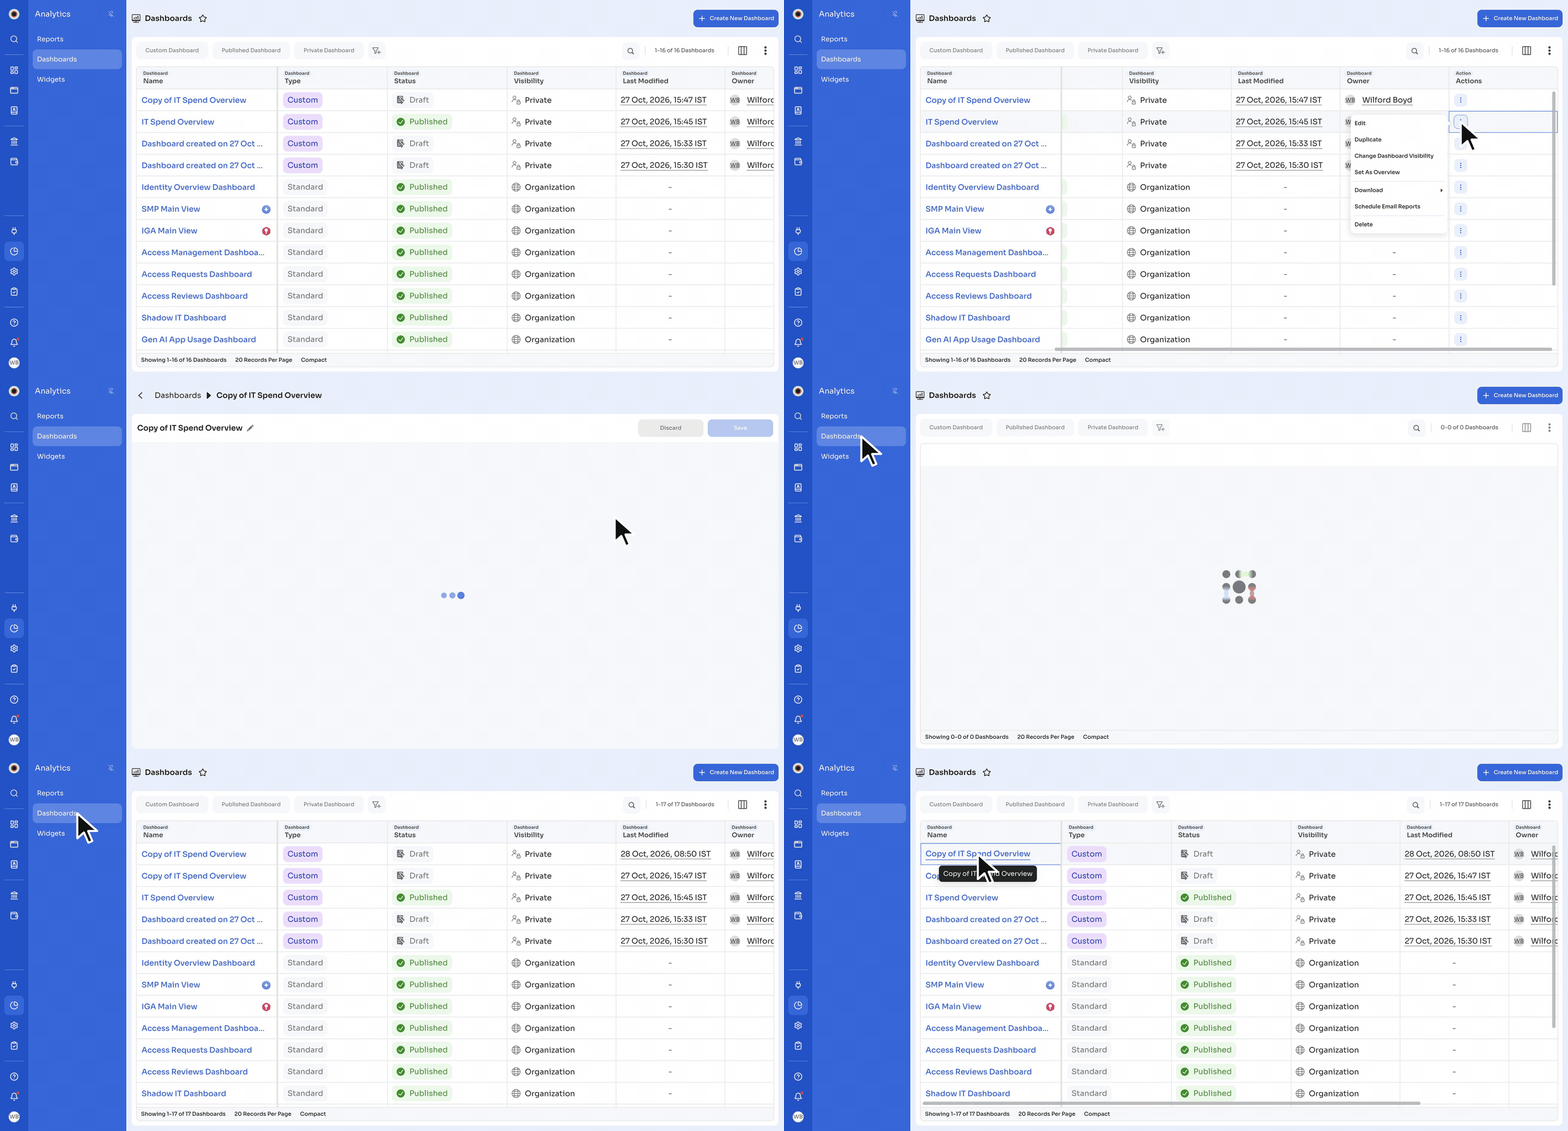
Duplicate a dashboard to make a separate copy with the same widgets and layout, which you can change without affecting the original.
- Go to Analytics → Dashboards.
- Find the dashboard you want to duplicate.
- Click the Actions menu (⋮) next to the dashboard and select Duplicate.
Zluri creates a copy named Copy of followed by the dashboard name and opens it in the dashboard editor. The copy is in Draft status, and you can edit it as needed.
Filter your dashboard
Most dashboard widgets support filters, so you can customize the data they show and analyze specific subsets of it.
You can apply:
- Widget-level filters: Apply only to individual widgets.
- Dashboard-level filters: Apply across most widgets on the dashboard.
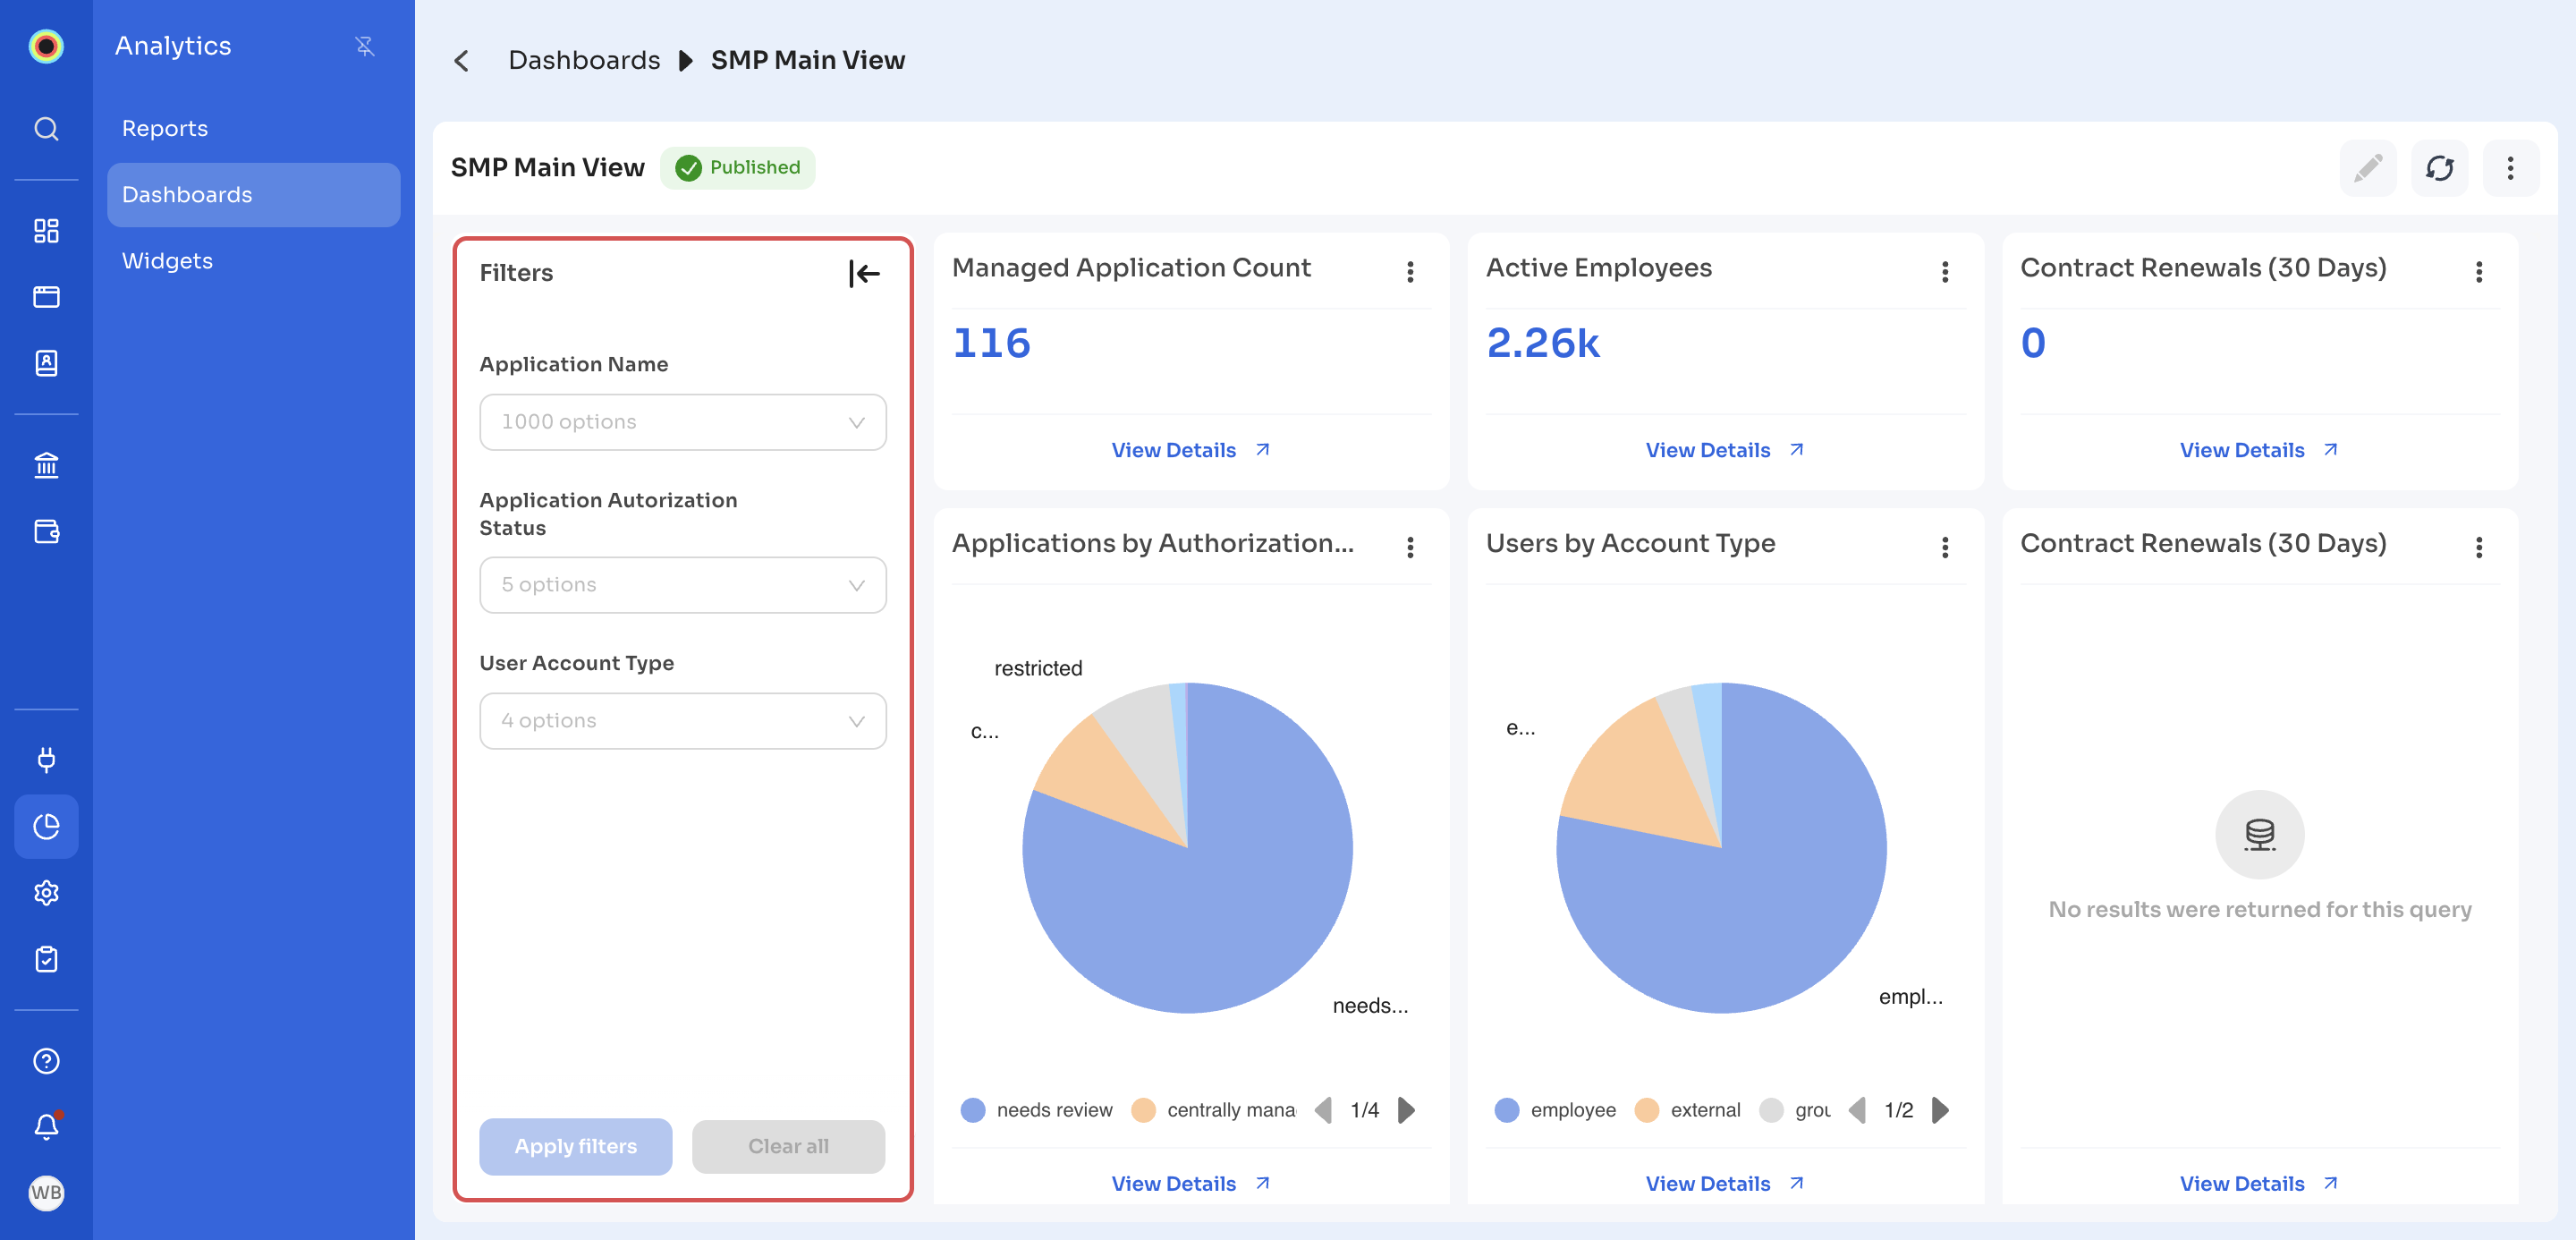
To use dashboard-level filters, open the dashboard and click the filter icon on the left. The Filters panel lists the dashboard's filters. Select the values, and then click Apply filters. Click Clear all to remove them.
When you apply a dashboard-level filter, the dashboard URL updates. If you copy and share the URL with others in your organization, the filters stay applied.
Download a dashboard
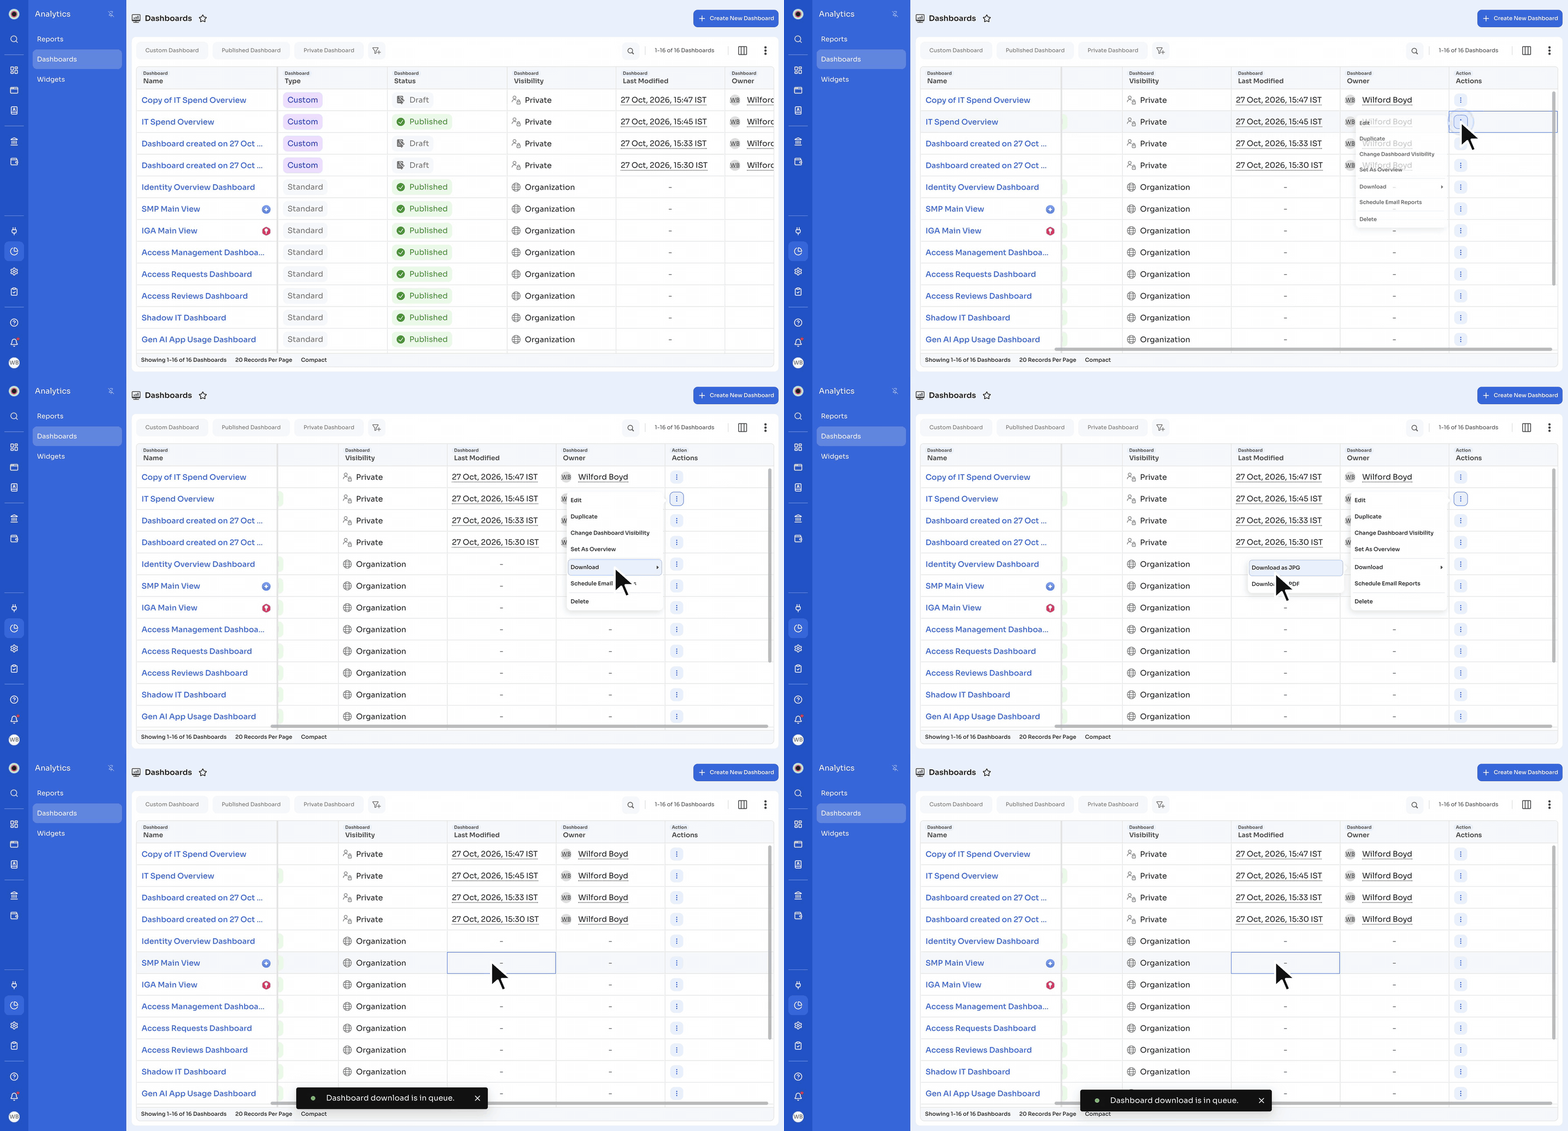
You can download a published dashboard as a JPG or PDF file. Draft dashboards can't be downloaded.
- Go to Analytics → Dashboards.
- Find the dashboard you want to download.
- Click the Actions menu (⋮) next to the dashboard and select Download.
- Select Download as JPG or Download as PDF.
Zluri shows Dashboard download is in queue.
Publish a dashboard
Publish a dashboard in Draft status to make it available either only to you (the owner) or to everyone in your organization.
- Open the draft dashboard you want to publish.
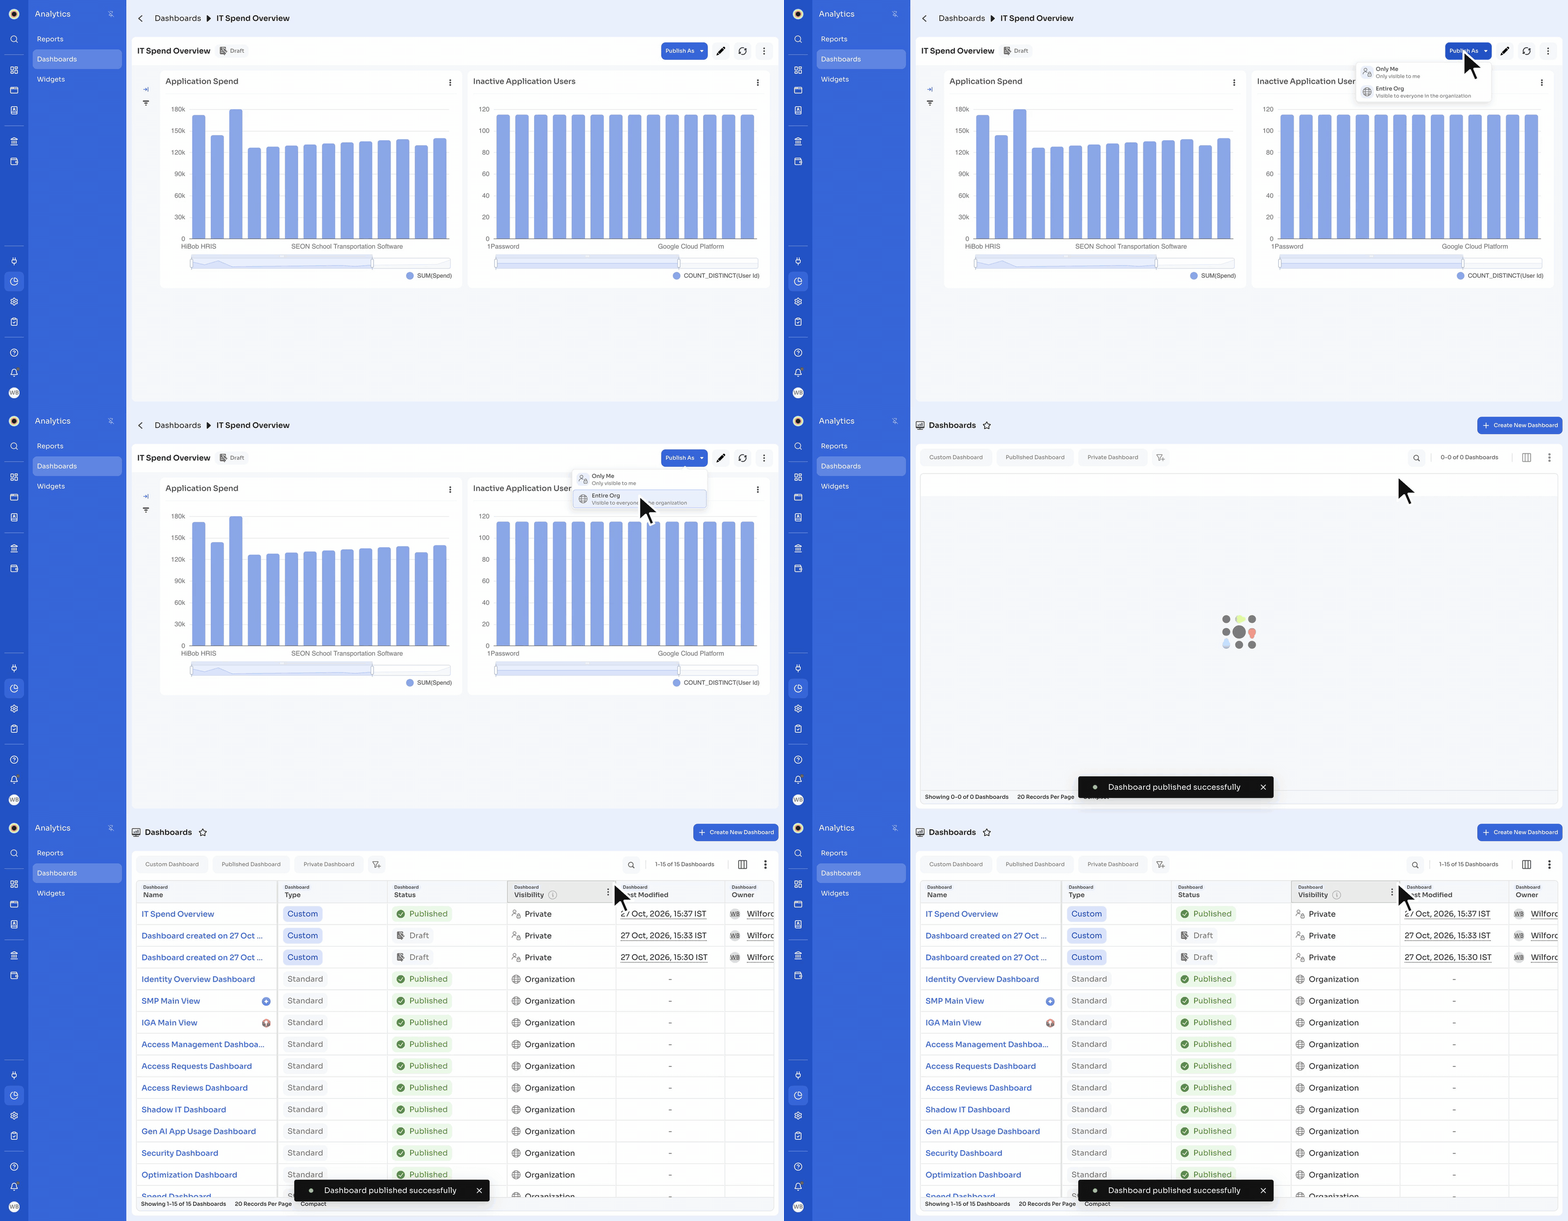
- Click Publish As in the top-right corner.
- Select one of the visibility options:
- Only Me: Makes the dashboard visible only to you, the owner.
- Entire Org: Makes the dashboard visible to everyone in the organization.
Zluri shows Dashboard published successfully. The dashboard's Status changes to Published, and its Visibility to Private (Only Me) or Organization (Entire Org).
Change dashboard visibility
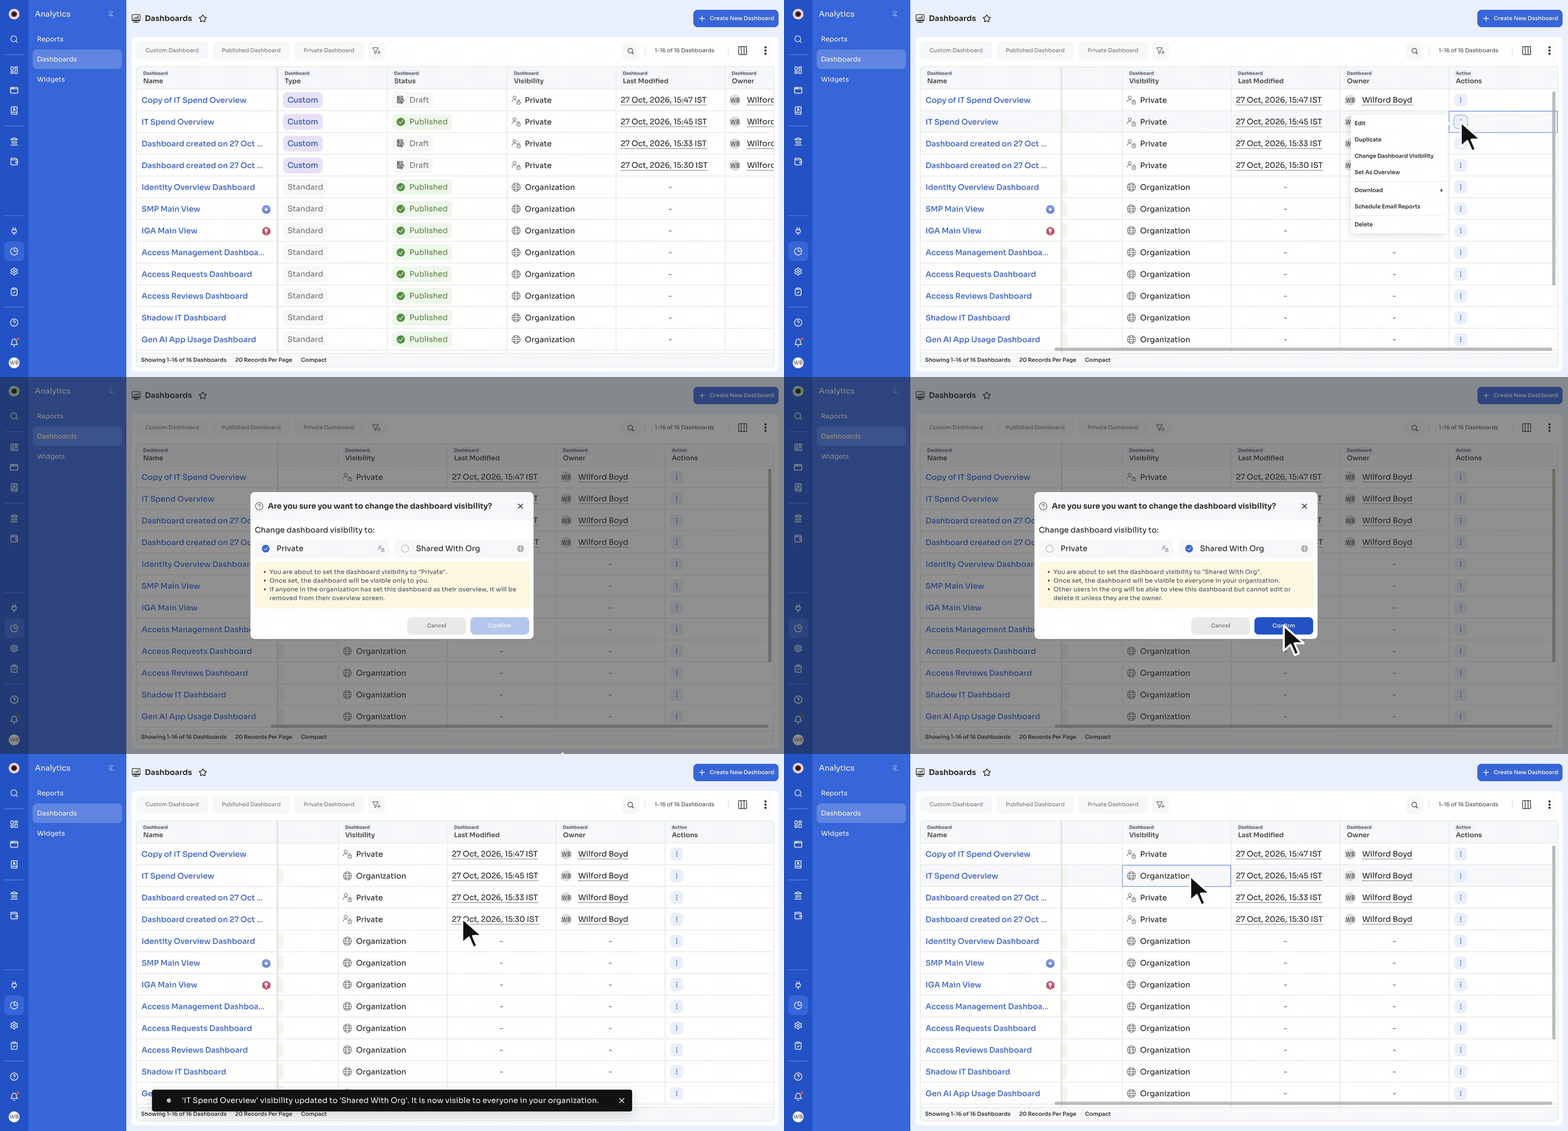
Change who can see a published dashboard you own.
- Go to Analytics → Dashboards.
- Click the Actions menu (⋮) next to the dashboard and select Change Dashboard Visibility.
- Under Change dashboard visibility to, select one of the following:
- Private: The dashboard is visible only to you. Other users in the organization can't view or access it. If anyone in the organization has set this dashboard as their Overview, Zluri removes it from their Overview screen.
- Shared With Org: The dashboard is visible to everyone in your organization. Only you, the owner, can edit or delete it.
- Click Confirm.
Zluri confirms the change, and the Visibility column shows Private or Organization.
Schedule email reports
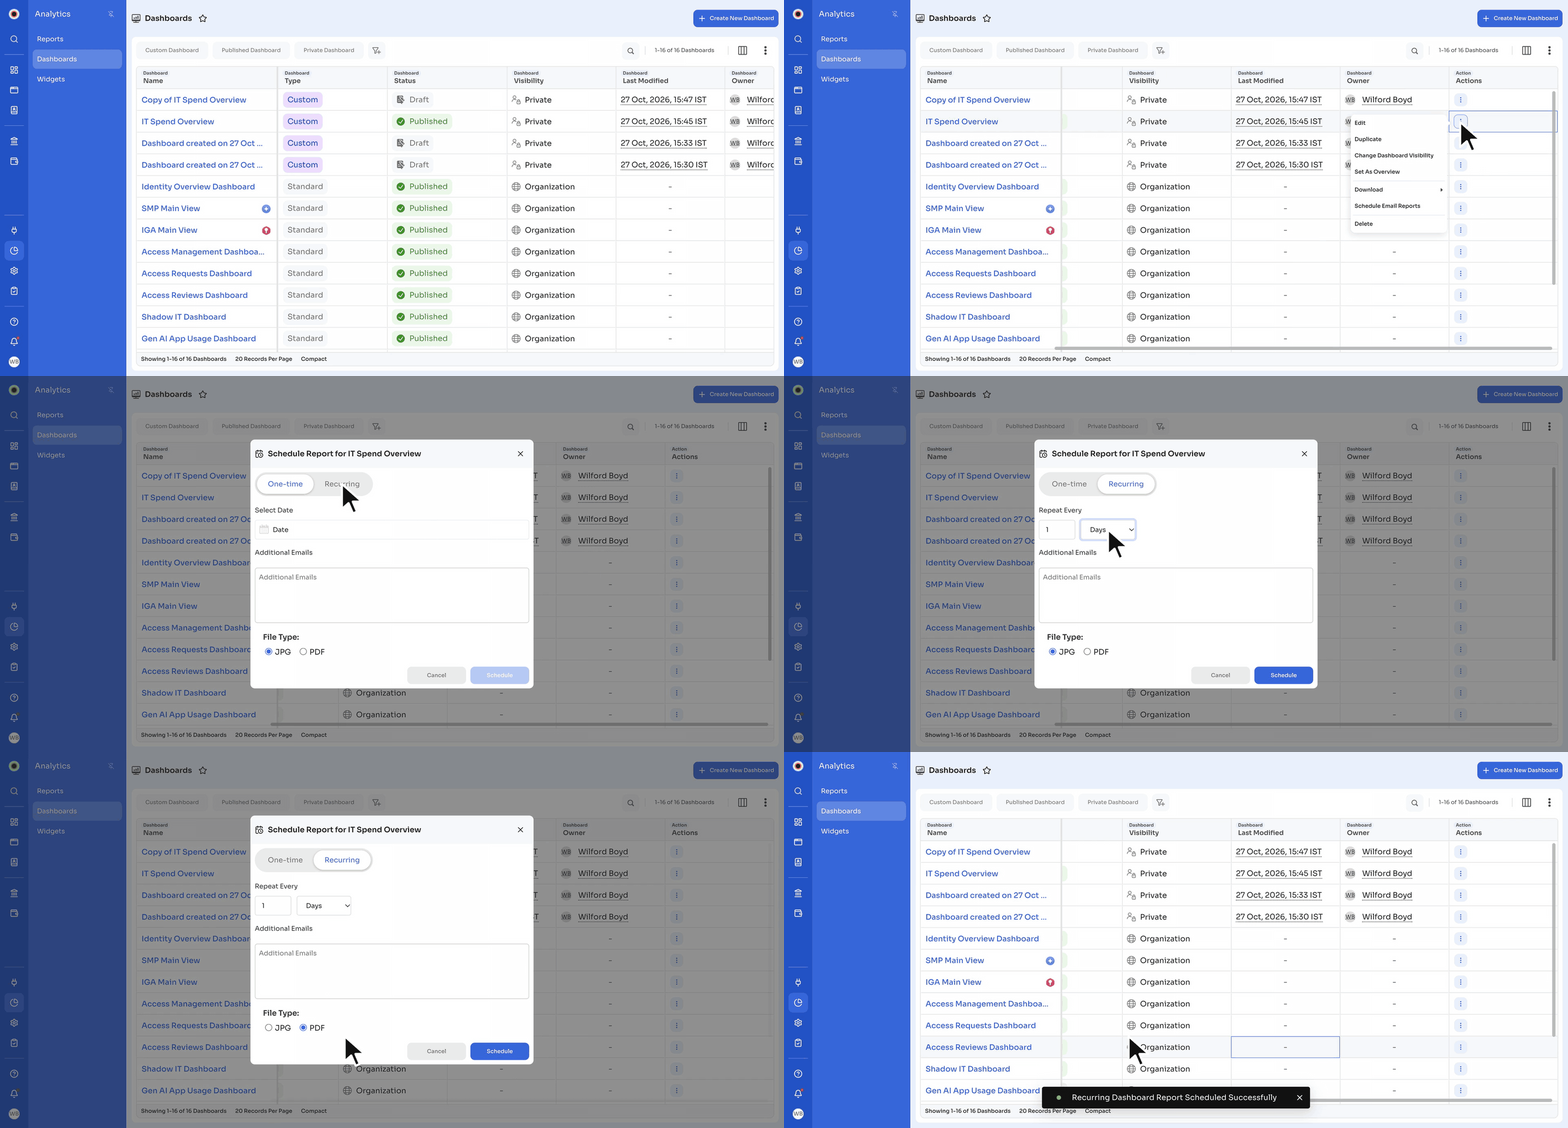
Schedule a dashboard so that Zluri emails it as a report, once or on a recurring basis. You can schedule only published dashboards.
- Go to Analytics → Dashboards.
- Click the Actions menu (⋮) next to the dashboard and select Schedule Email Reports.
- In the window titled Schedule Report for followed by the dashboard name, choose how often to send it:
- One-time: Select the date in Select Date.
- Recurring: In Repeat Every, enter a number and select days, weeks, months, or years. For weeks, also select the day under Repeat On (Mon to Sun).
- In Additional Emails, add anyone else who should receive the report.
- Under File Type, select JPG or PDF.
- Click Schedule.
For a recurring schedule, Zluri shows Recurring Dashboard Report Scheduled Successfully. The schedule appears in Analytics → Reports → Scheduled Reports as the dashboard name followed by Export. See View and delete scheduled reports.
Delete a dashboard
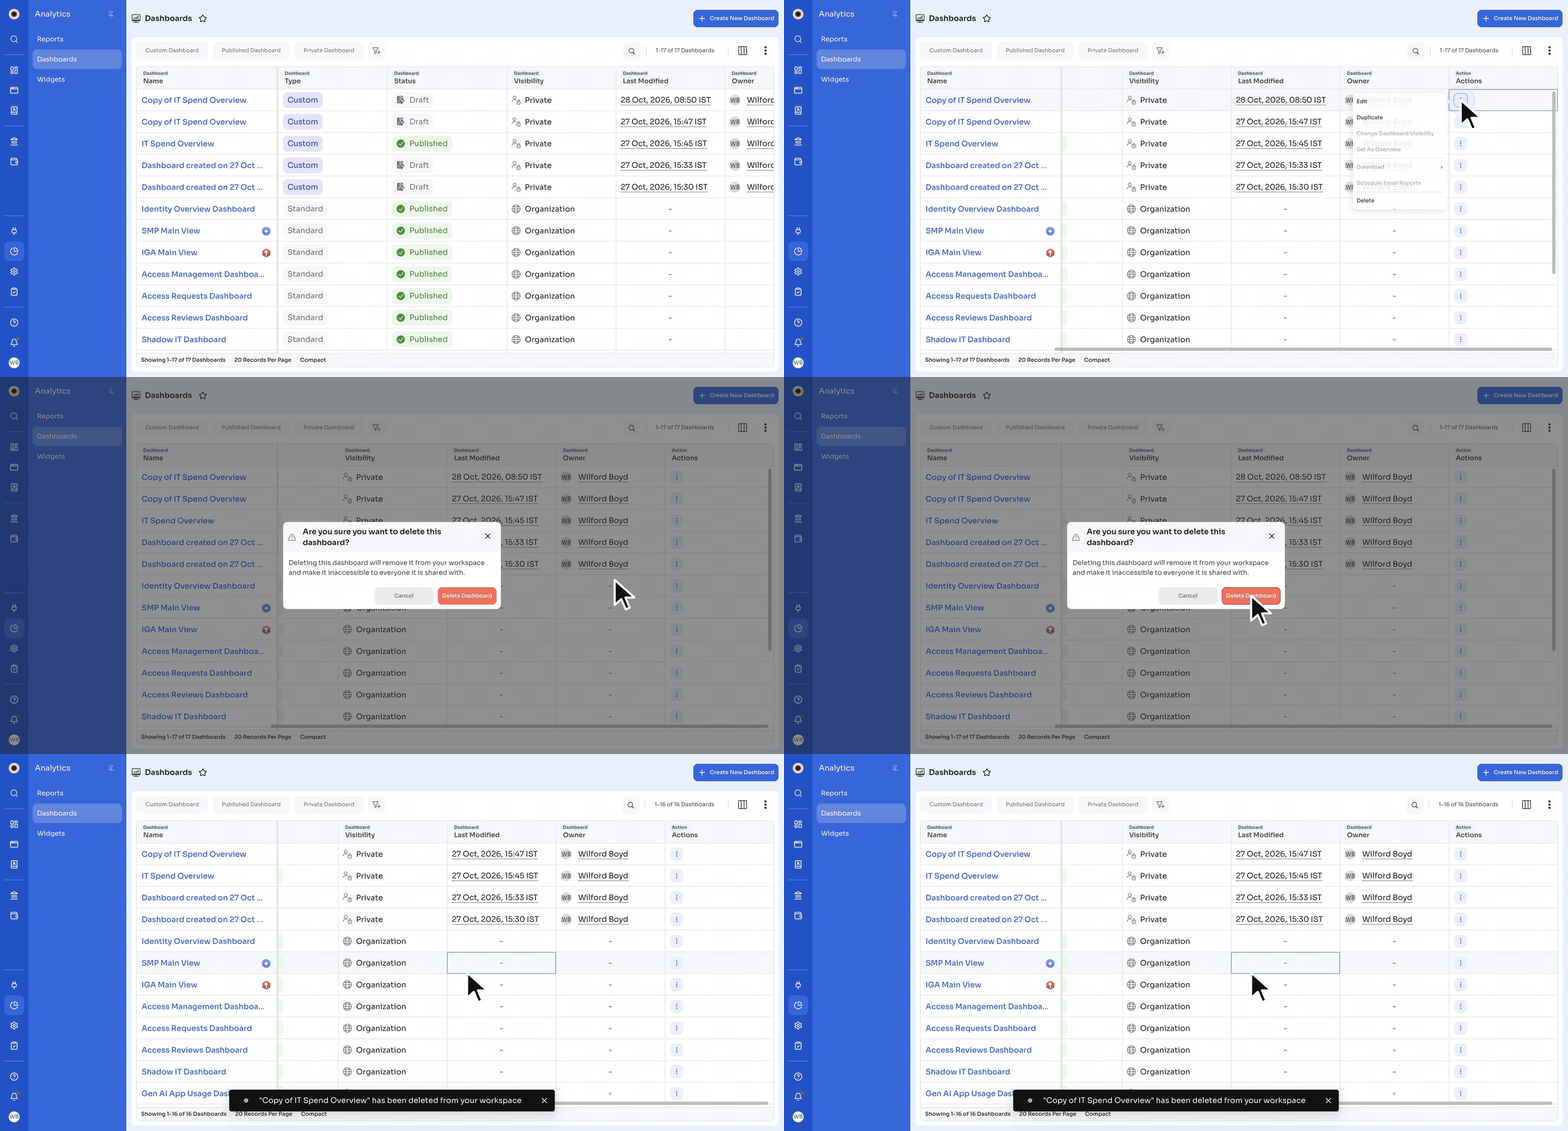
Warning: Deleting a dashboard removes it for everyone it's shared with.
- Go to Analytics → Dashboards.
- Click the Actions menu (⋮) next to the dashboard and select Delete.
- In Are you sure you want to delete this dashboard?, click Delete Dashboard.
Updated 18 minutes ago