
Chart Types in Zluri
When you create a widget in Zluri, you select a dataset and apply a chart type, which defines how the data is displayed.
How Charts Work
Each widget is a combination of:
- Dataset: The underlying data (for example, users, applications, spend)
- Chart Type: The visualization method (for example, Bar Chart, Number, Table)
- Configuration: Field selection, filters, and formatting
The fields available in the dataset influence which chart types are supported.
Supported Chart Types
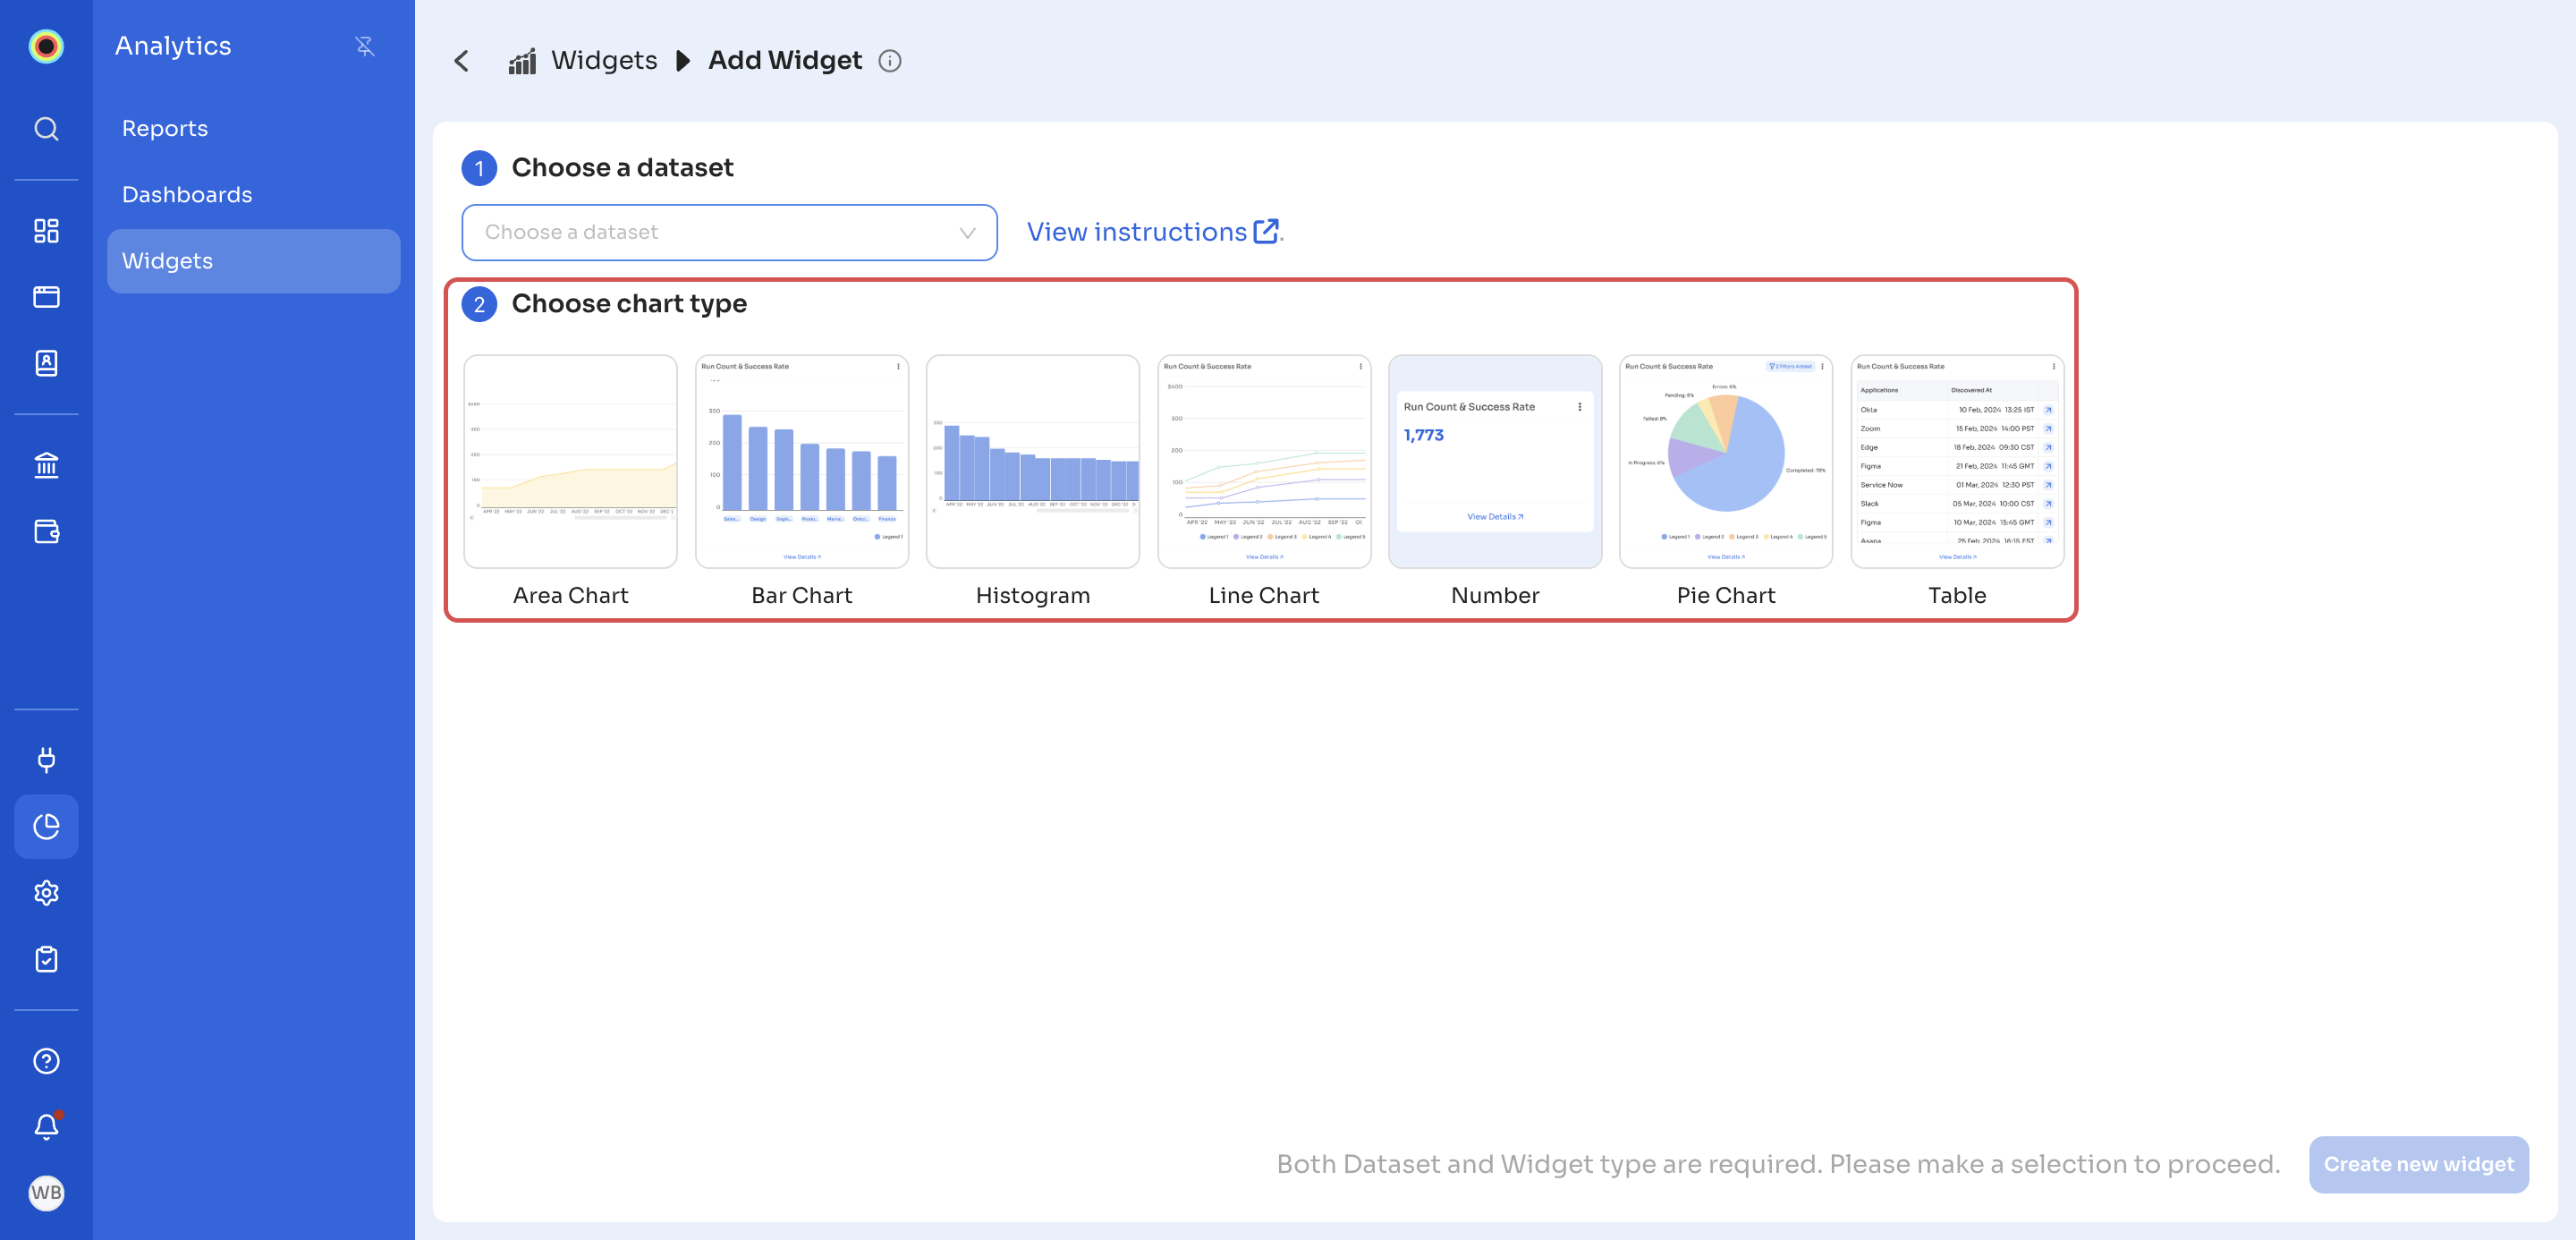
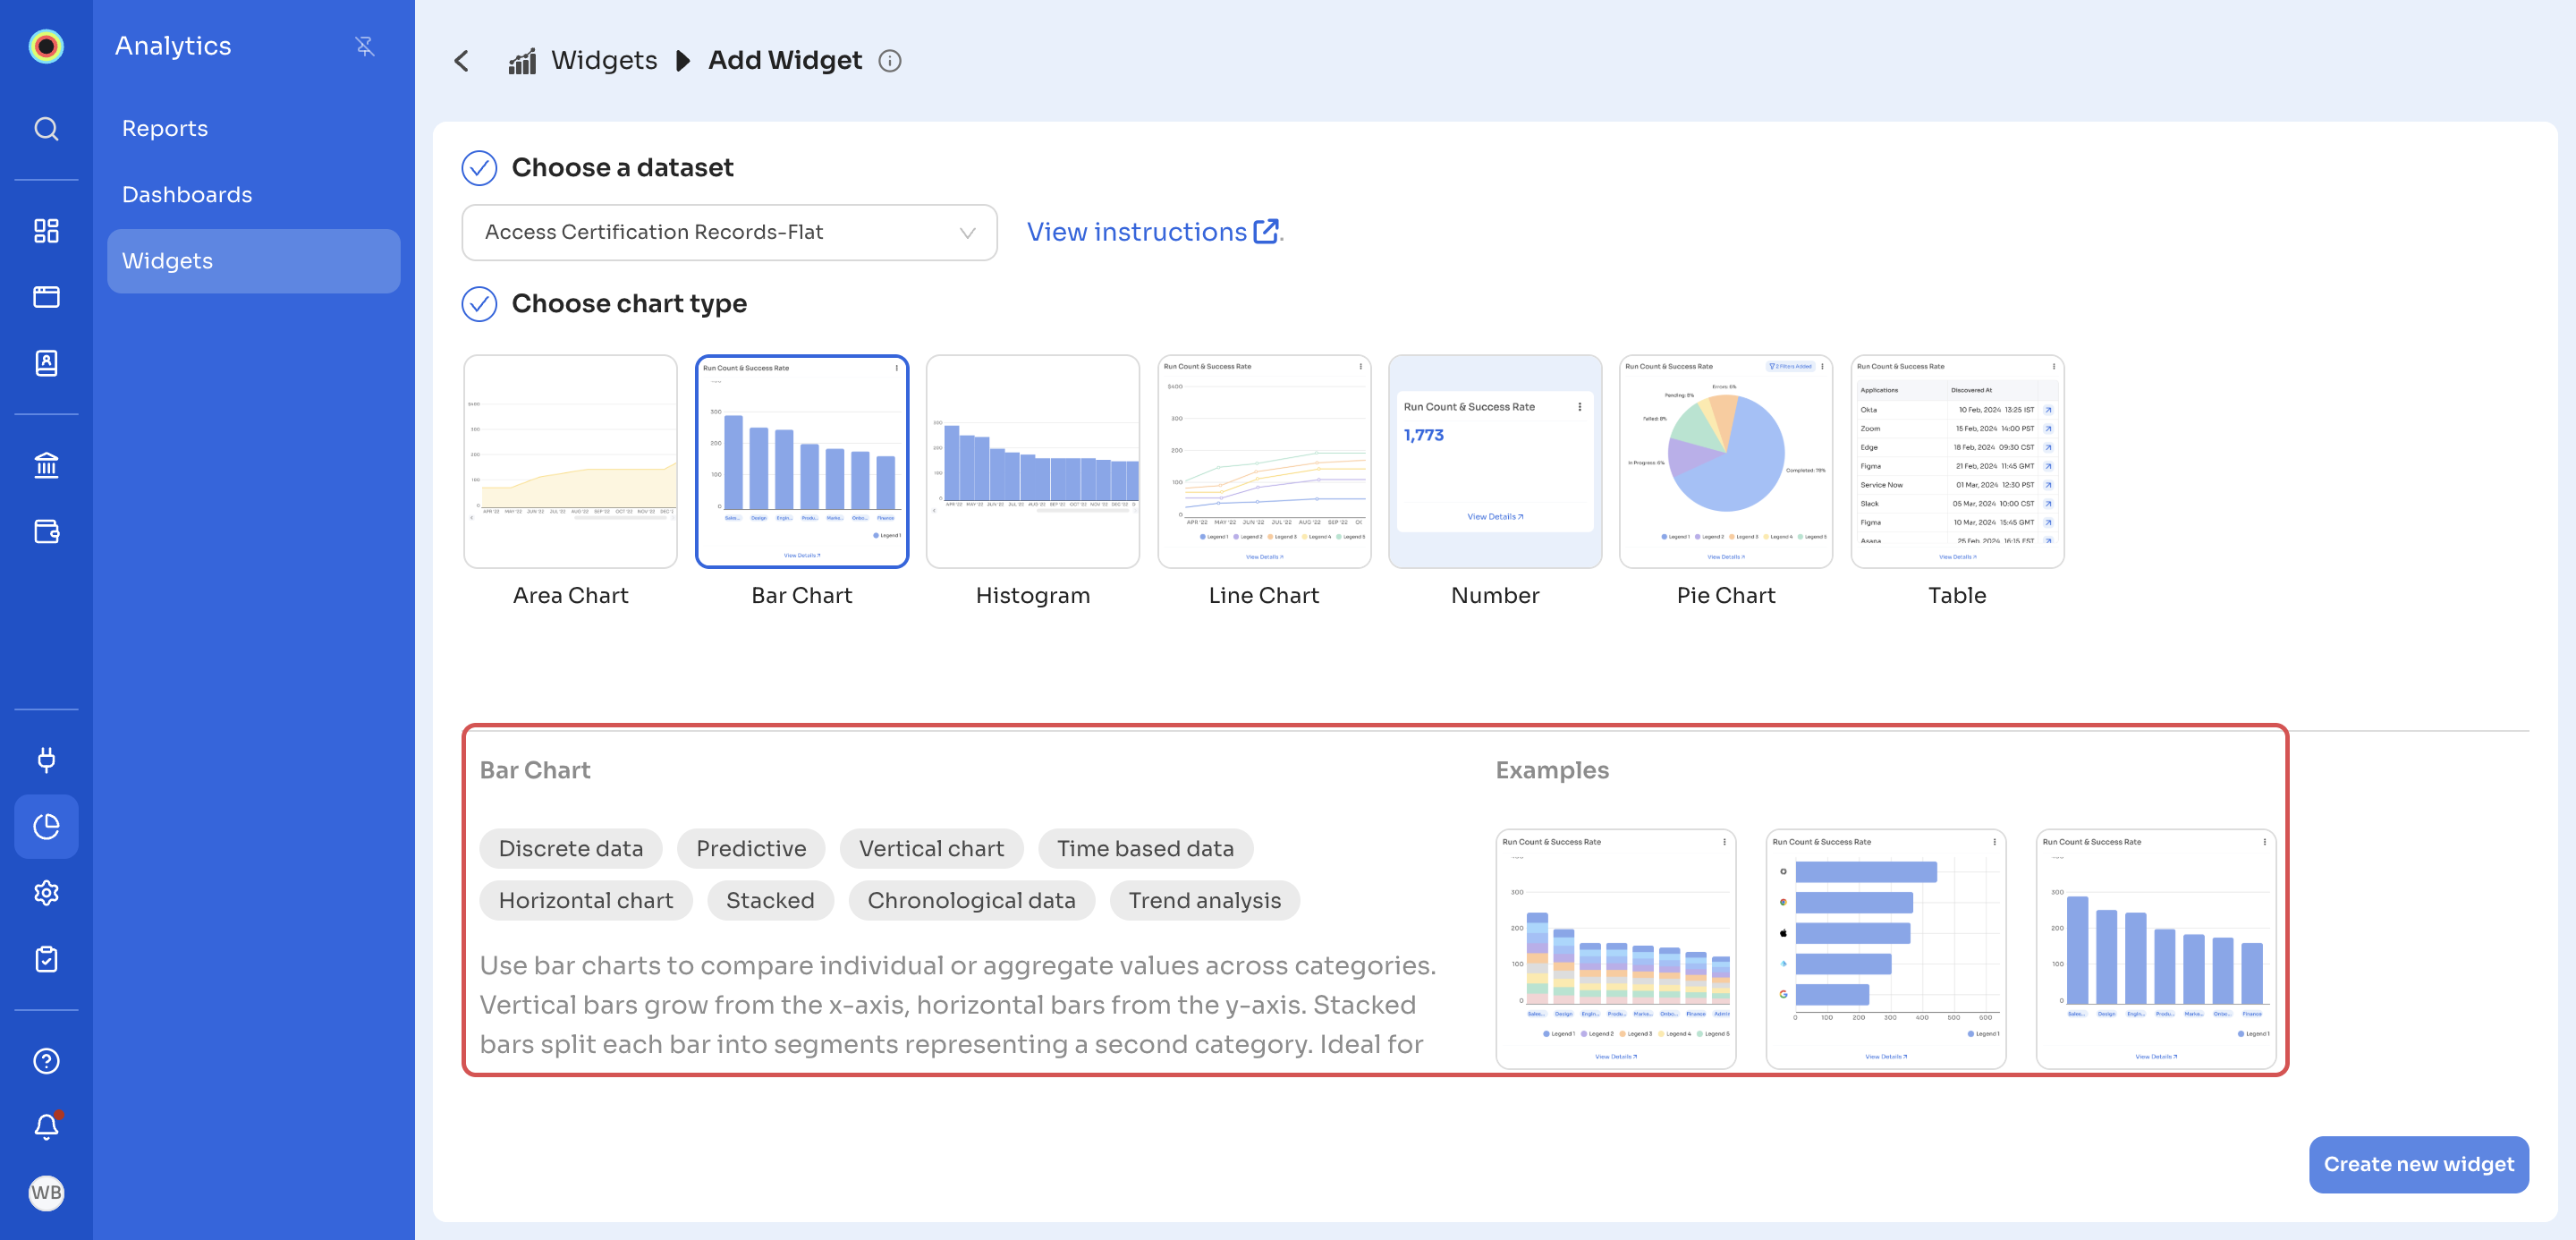
Under Choose chart type on the Add Widget page, you can select one of seven chart types: Area Chart, Bar Chart, Histogram, Line Chart, Number, Pie Chart, and Table. When you select a chart type, Zluri shows its tags, a short description, and examples.
The seven chart types appear under Choose chart type:
For example, selecting Bar Chart shows these details:
1. Line Chart
Plots data points over time to visualize trends.
- Use cases:
- Application spend trends
- Login activity over weeks or months
- License growth tracking
2. Bar Chart
Compares values across categories. Bar charts can be vertical, horizontal, or stacked.
-
Use cases:
- Spend by app
- Access requests by department
- App usage by location
-
Tags:
Discrete data,Predictive,Vertical chart,Time based data,Horizontal chart,Stacked,Chronological data,Trend analysis
3. Table
Displays raw, detailed data in rows and columns.
- Use cases:
- App-wise license and usage breakdown
- User access listings
- Contract metadata summaries
4. Number
Highlights a single metric: a total, average, or percentage.
- Use cases:
- Total SaaS spend
- Number of active users
- License utilization percentage
5. Pie Chart
Visualizes part-to-whole relationships using circular segments.
- Use cases:
- Spend distribution by vendor
- Users by department
- App usage by geography
6. Histogram
Displays frequency distribution by grouping numeric values into bins.
- Use cases:
- Access duration analysis
- User distribution by activity
- Cost segmentation
7. Area Chart
Highlights cumulative trends with shaded areas under lines.
- Use cases:
- Cumulative license assignment
- Monthly spend growth
- Access growth by department
Choosing the Right Chart
| Goal | Recommended Chart Type |
|---|---|
| Show trends over time | Line Chart, Area Chart |
| Compare categories | Bar Chart |
| Show parts of a whole | Pie Chart |
| Highlight a key metric | Number |
| Display detailed records | Table |
| Visualize distribution | Histogram |
Chart Type Quick Reference
| Chart Type | Best For | Example Use Case |
|---|---|---|
| Line Chart | Time-based trends | App spend trend per month |
| Bar Chart | Category comparisons; stacked bars for multi-dimensional breakdowns | Apps with highest user count; access levels by department (stacked) |
| Pie Chart | Part-to-whole comparisons | Spend by department |
| Number | Key metrics and KPIs | Total SaaS spend |
| Table | Detailed reporting | License count vs. usage |
| Area Chart | Cumulative analysis | Cumulative licenses issued |
| Histogram | Distribution and outliers | User count by login frequency |
Pro Tips
- Use -Flat datasets for high-level KPIs and summaries.
- Use -Expanded datasets for detailed, user-level views.
- For a Pie Chart, Bar Chart, or Line Chart on an -Expanded dataset, use groupings or the COUNT_DISTINCT aggregate (under METRICS, in the My metric panel) so that each record is counted once. For example, to count unique users, use COUNT_DISTINCT on a user column such as User ID.
- When unsure, use a Table to preview the dataset layout.
Updated 18 minutes ago