
Custom Dashboards & Widgets Best Practices
Zluri provides standard dashboards and widgets, and you can create custom ones for your own needs. Follow these practices to make them clear and useful.
Define the Goal and Know the Purpose & Audience
- The best visualizations have a clear purpose and work for their intended audience. What do you want to say with this dashboard?
- Are you presenting a conclusion or a key question?
- Include only what's important: every widget should support the dashboard's purpose.
Besides knowing what you want to say, know who your audience is.
- Does your audience have extensive knowledge of this subject matter, or will it be new to them? What kind of cues will they need? Answer these questions before you start building the dashboard.
Choose the Right Visualization
- Use the most efficient visualization: a good visualization is quick to understand. See Chart Types in Zluri.
- A dashboard can hold up to 15 widgets.
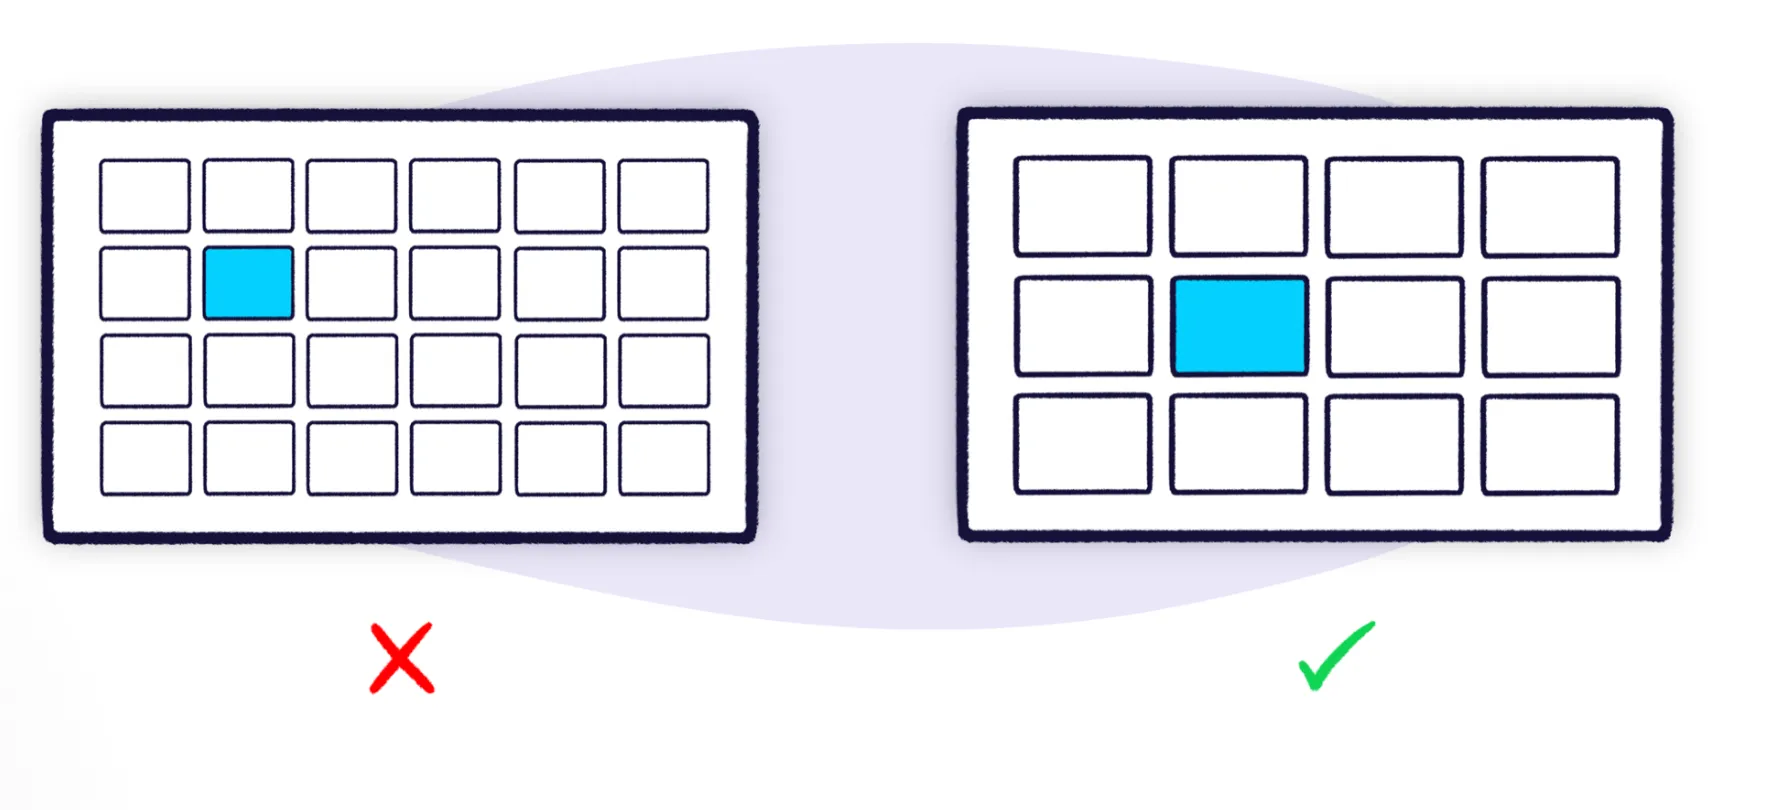
- People aren't good at comparing spatial areas, so pie charts and area charts are rarely the best choice of visualization.
Setting a Dashboard for Overview
Setting a Dashboard for Overview in Zluri explains how to set a dashboard as the Overview and the rules that apply.
Lay Out and Label Widgets
To create a widget, see Widgets.
- Position the information on your dashboard logically. Place related widgets next to each other so viewers can compare them easily.
- Give each widget a title that says what it shows.
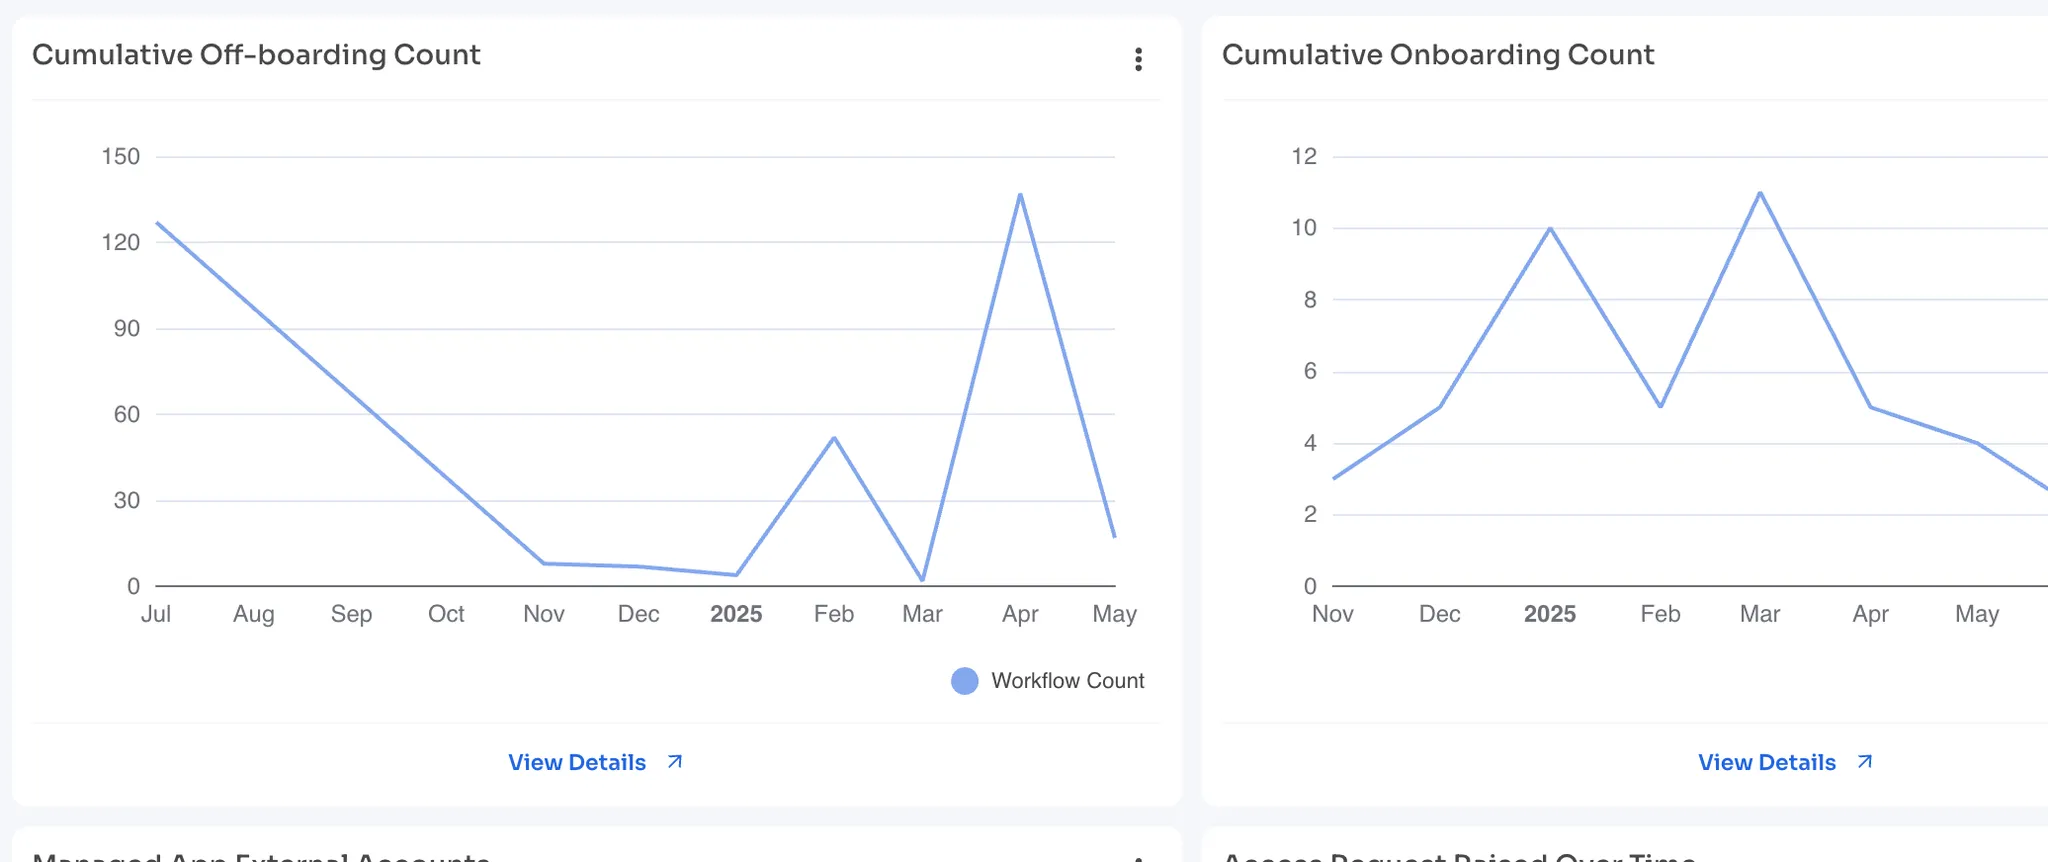
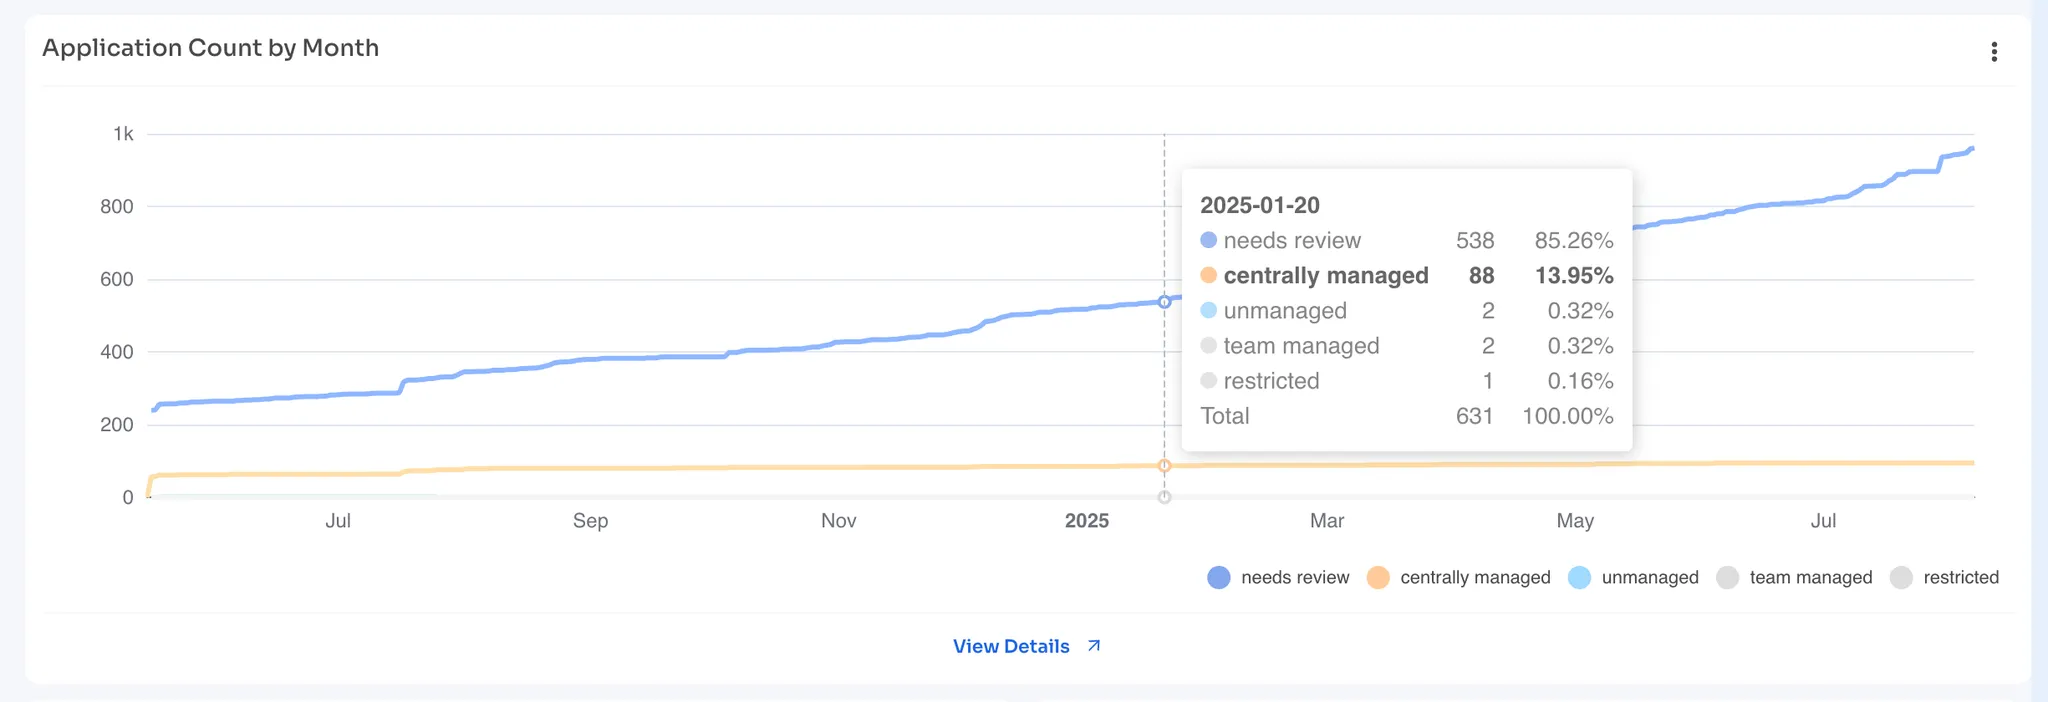
- Use clear legends and labels that viewers understand.
Best Practices for Widget Redirect URLs
- Redirect to Zluri pages your viewers already use, such as an application's Users tab.
- Use hash fragments (the part after
#) to take viewers straight to the section where they need to act.
For the redirect types, the URL-to-JSON converter, and how to test redirects before saving a widget, see Widget Redirect URLs in Zluri.
Updated 18 minutes ago
Did this page help you?