
Dataset in Zluri
A dataset in Zluri is a structured collection of data pulled from various modules across your organization's Zluri account. Datasets are the basis for both standard and custom widgets used in dashboards.
A dataset defines what data is available; a widget defines how it's shown.
Relationship Between Datasets and Widgets
- A widget is a visual layer (such as a Bar Chart, Table, or Number) built on top of a dataset.
Using a Dataset to Create a Widget
Several widgets can use the same dataset. For example:
| Dataset | Widgets built on it |
|---|---|
| Applications-Expanded | Recently Used AI Applications (Table), Recently Discovered Shadow AI Applications (Table), Shadow AI Applications (Number) |
| Access Request-Flat | Total Access Requests Raised (Number), Access Requests by Status (Pie Chart) |
Example Use Case
Suppose a dataset tracks monthly users of your AI apps. From it, you can build:
- A Line Chart for weekly usage trends
- A Number widget showing total active users
- A Table listing users by department or application
Dataset Structures: Flat vs. Expanded
Every dataset name ends in -Flat or -Expanded, which tells you how its rows are structured.
1. Flat Dataset
Flat datasets contain one-to-one mapped fields. Each row represents a unique entity with no nesting.
Characteristics:
- One row per record
- No repeating or nested fields
- Simple structure for visualization and aggregation
Best For:
- Number widgets (for example, total users or average apps per user)
- Bar Chart widgets grouped by role or department
- Simple tables with summary data
2. Expanded Dataset
Expanded datasets include normalized or relational fields. One entity (like a user) can span multiple rows because of related data.
Characteristics:
- One-to-many relationships across rows
- Supports granular filtering and grouping
- Requires grouping or a distinct count (the COUNT_DISTINCT aggregate under METRICS) to avoid counting a record more than once
Example Table (columns from App-to-User Mapping-Expanded):
| User Name | App Name | User Application Role |
|---|---|---|
| Alice | Slack | Admin |
| Alice | Notion | Member |
| Bob | Zoom | Admin |
Best For:
- Access reviews (users with multiple apps or roles)
- Multi-dimensional filters (user + app + access)
- Breakdown charts (for example, a stacked Bar Chart)
Dataset Selection Guide
| Use Case | Recommended Dataset |
|---|---|
| Summary KPIs | Flat |
| Advanced filters (for example, app + role) | Expanded |
| Simple counts per entity | Flat |
| Hierarchy or relationship analysis | Expanded |
Prebuilt Datasets in Zluri
Zluri offers the following prebuilt datasets.
| Dataset | Description |
|---|---|
| App-to-User Mapping-Flat | User application activity and access |
| App-to-User Mapping-Expanded | Mapping users to applications showing activity and access levels for insight into behavior and permissions |
| Application Cost & Spend Summary-Flat | Monthly overview of app cost and spend |
| Access Certification Records-Flat | Reviewed records in access certifications |
| Access Certifications-Flat | User access certification details |
| Access Request-Flat | Access requests approvals and workflows |
| App Cost Breakdown-Flat | Detailed breakdown of application costs |
| App Spend Optimization-Flat | Suggestions to optimize app usage |
| App Spend Summary-Flat | Total Application spend data by billing |
| App User Accounts-Flat | Mapped users to app with account and access info |
| Applications Cumulative Count-Flat | Cumulative applications onboarded over time |
| Applications-Expanded | Detailed overview of all active software applications used across departments, including their purpose and users |
| Applications-Flat | Applications in use across organization |
| Continuous Optimization-Flat | Continuous cost-saving recommendations tracking |
| Contract Repository-Expanded | Dataset to fetch contract level details like date, type, and detailed information about the apps in that contract including owners, cost |
| Contract Repository-Flat | Dataset to fetch contract level details like date, type, and the apps in it |
| Employee/User directory-Flat | Active and inactive organizational users |
| Licenses-Flat | Overview of purchased consumed licenses |
| Org User Onboarding Offboarding-Flat | Onboarding/offboarding workflows and automations |
| Spend by Cost Center-Flat | App spend grouped by cost center |
| Spend by Department-Flat | Aggregated app spend by department |
| User License Allocation-Flat | User licenses assigned across applications |
| User-Level Spend-Flat | Total SaaS spend per user |
| Vendor Cost and Spend Summary-Flat | Contracted cost and actual spend for each of your vendors, month by month. Every row represents one vendor in one month. |
| Workflow executions-Flat | Automations and workflows via playbooks and actions |
| Application Identity Access-Flat | Maps each identity to the applications it can access and flags any privileged access. |
| Identity Account Relationship-Flat | Relation between Identities and different states of Accounts |
| Identity Details-Flat | Covers every identity in the org, with its type, status, lifecycle dates and secret details. |
| NHI Privilege and Ownership Details-Flat | Lists every non-human identity with its status, type, group, privilege flag and orphan flag. |
| Owned NHIs-Flat | Links each NHI to its owning user or group, with the owner's status, archival state and offboarding date. |
| Policy and Exemption Insights-Expanded | Analyzes policy enforcement and exception usage |
| Policy Violation Insights-Expanded | Captures policy violations, remediation activity, severity, and resolution timelines. |
How to Use a Dataset to Create a Widget
To build a widget from any dataset:
-
Go to Analytics → Widgets.
-
Click Create New Widget.
-
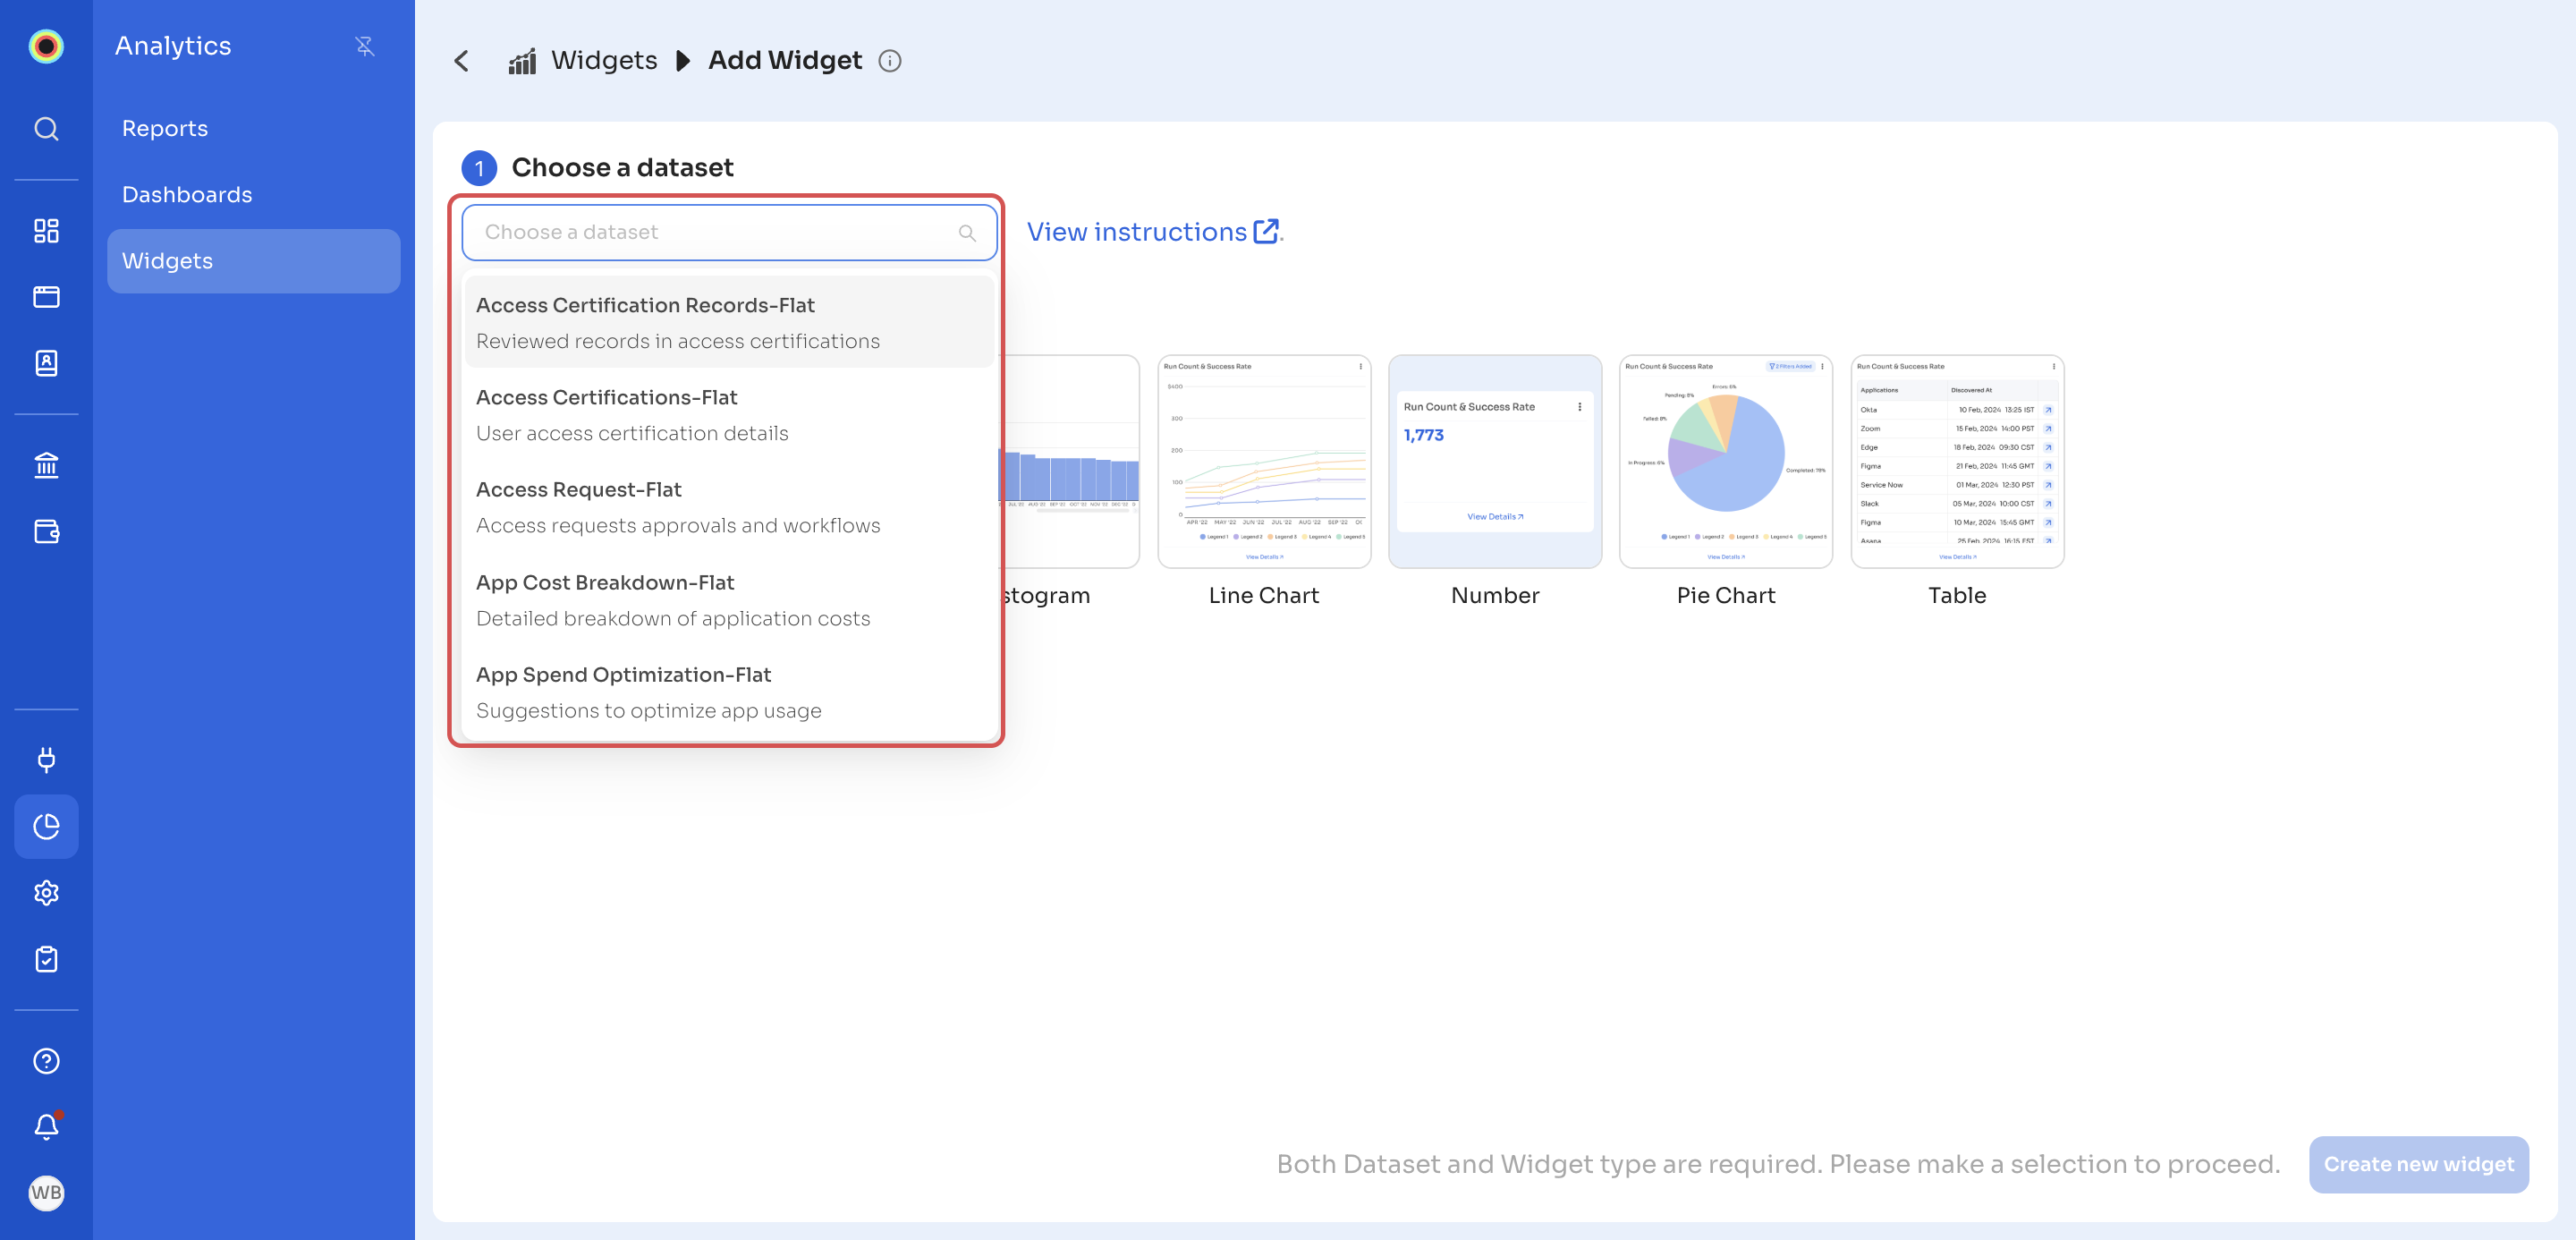
Under Choose a dataset, select a dataset. Each dataset shows a one-line description. You can select only one dataset per widget.
The Choose a dataset list, with each dataset's description:
-
Under Choose chart type, select the chart, then click Create new widget.
-
Configure the widget. See Widgets.
-
Save the widget and add it to a dashboard. See Create a dashboard.
Best Practices
- Use Flat datasets for fast rollups and KPI-level summaries
- Use Expanded datasets for deep-dive visualizations and filtering
- In expanded datasets, always use grouping or the COUNT_DISTINCT aggregate to avoid overcounts. In the widget editor, click METRICS and, in the My metric panel, choose COUNT_DISTINCT under AGGREGATE. For example, to count unique users, use COUNT_DISTINCT on a user column such as User ID.
Updated 18 minutes ago