
Analytics in the Core Platform
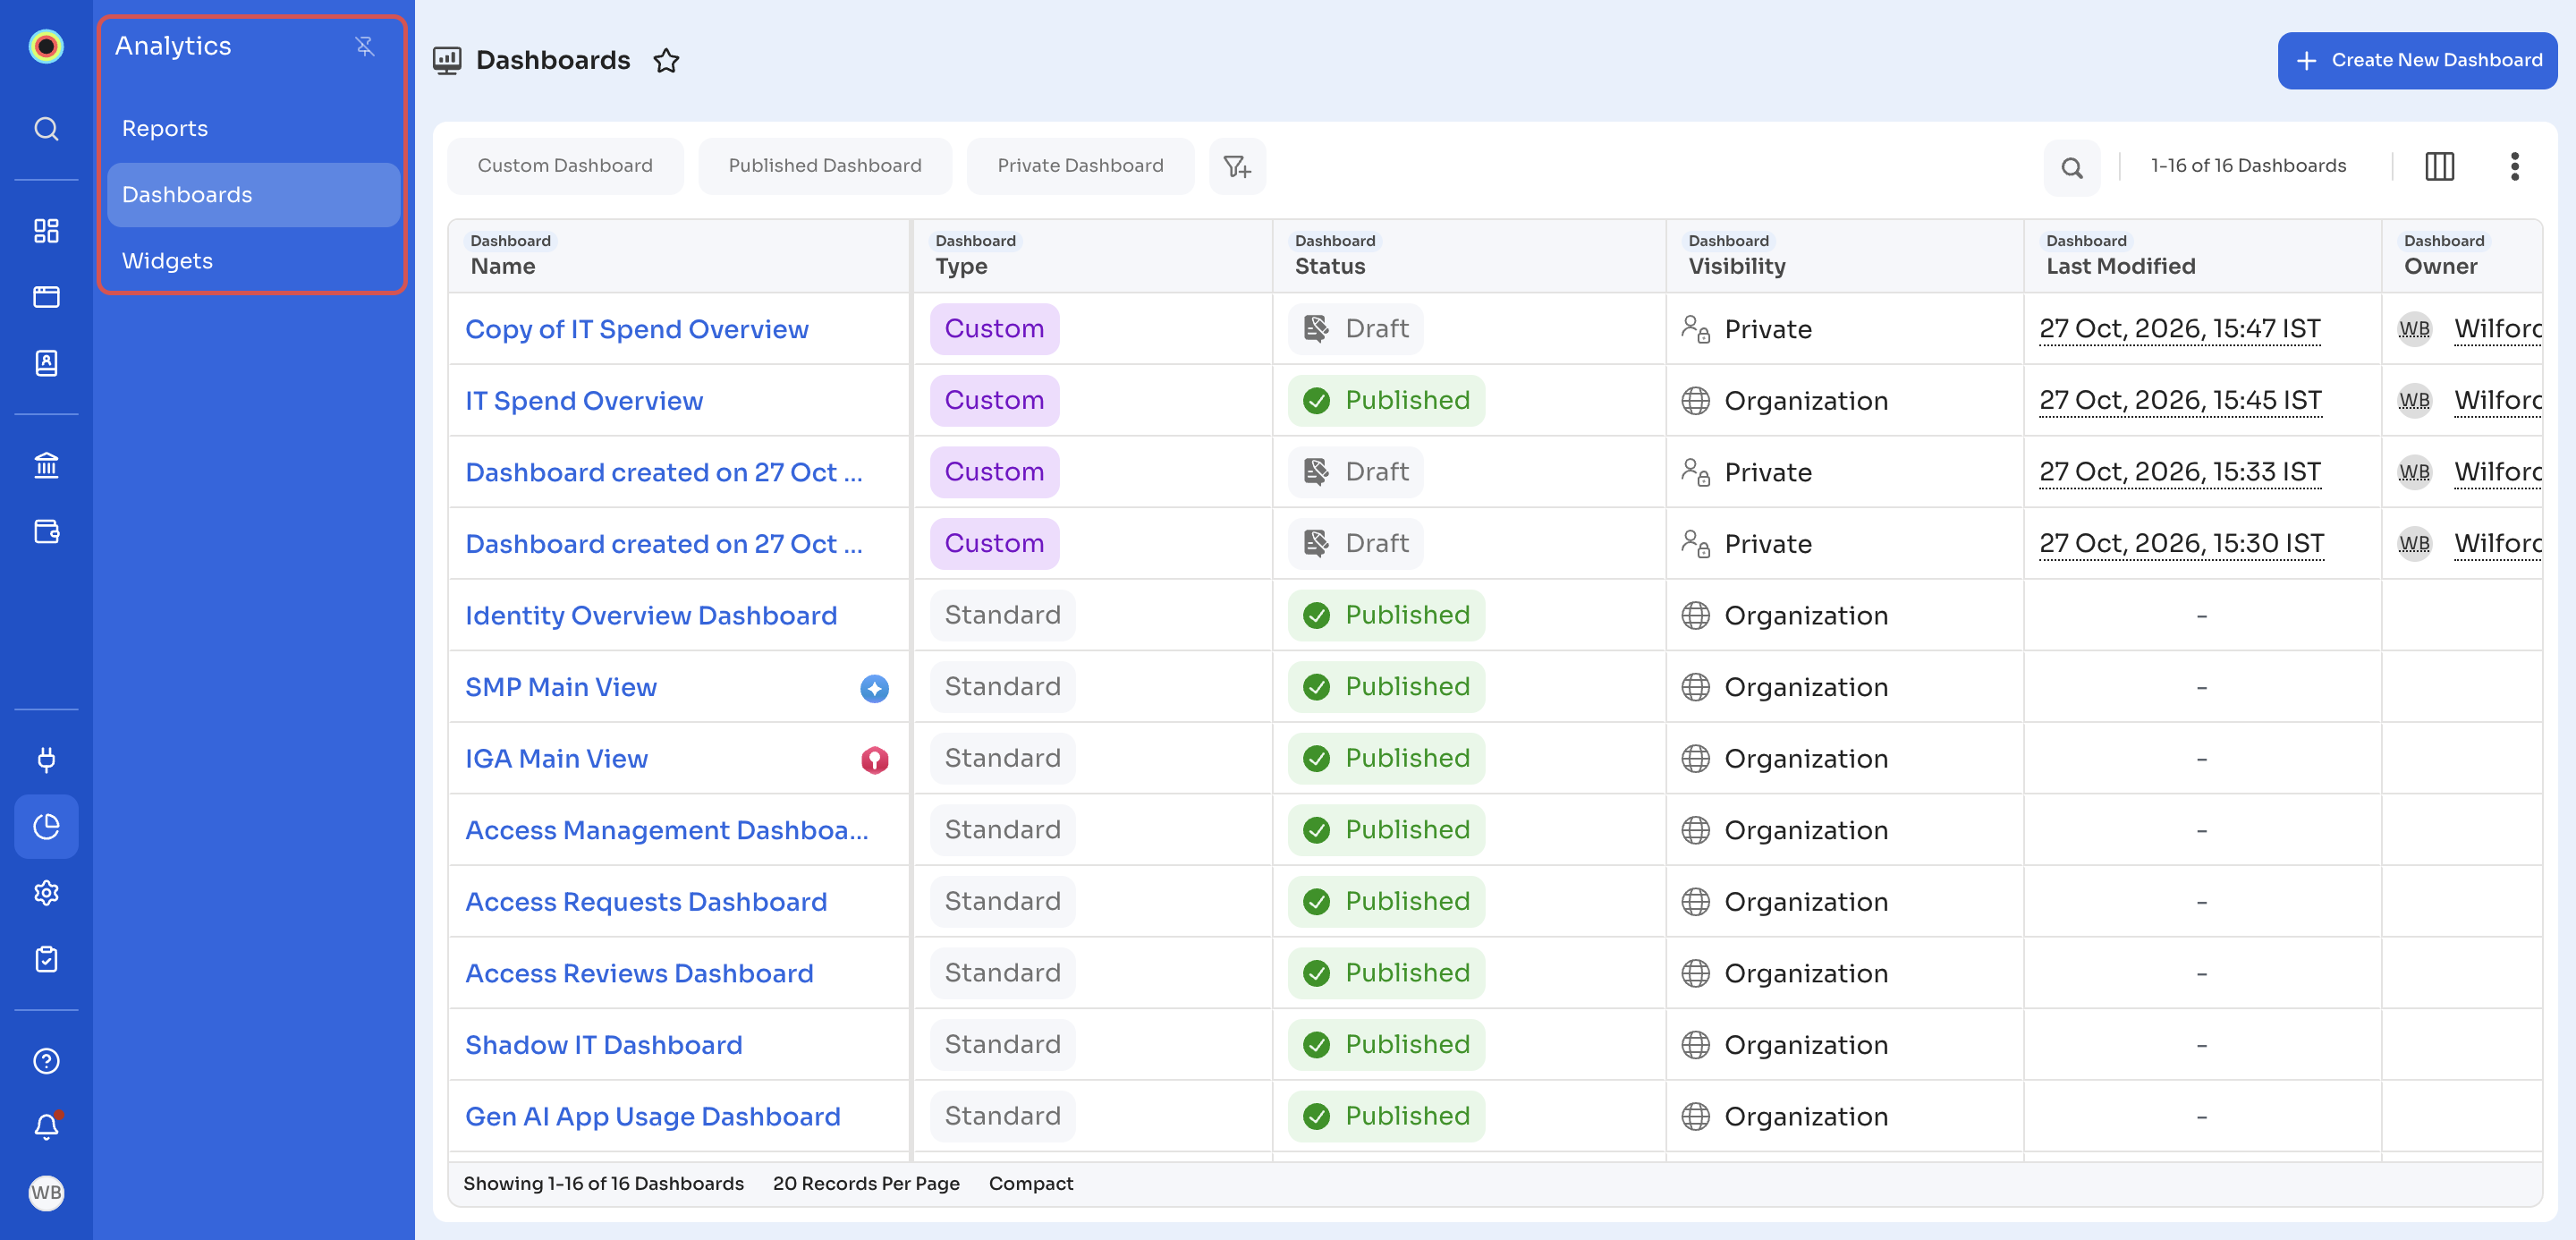
Analytics in the left navigation has three pages: Reports, Dashboards, and Widgets. This article also explains the Overview page and datasets, which dashboards and widgets are built on.
These parts build on each other. An Overview is a dashboard. A dashboard is made of widgets, and each widget combines a dataset with a chart.
Overview
The Overview is the default landing page when you open Zluri's Identity Governance and Administration (IGA) or SaaS Management Platform (SMP) module. It shows a dashboard that you or your organization set as the Overview, or the Zluri Default Overview if none is set. See Setting a Dashboard for Overview in Zluri.
Dashboard
A Dashboard is a customizable collection of widgets that gives you visual insights into areas such as access reviews, offboarding progress, app usage, and risk scores. You can:
- Create a dashboard and add widgets to it.
- Publish it for yourself only (Only Me) or for everyone in your organization (Entire Org).
- Set a published dashboard as an Overview.
Zluri also includes 12 pre-built dashboards. See Pre-built dashboards in the Dashboard article.
Dataset
A Dataset is a structured collection of data tied to specific entities such as:
- Users
- Applications
- Workflows
- Activities
A widget uses a dataset as its source data. See Dataset in Zluri.
Widgets
Widgets are the visual building blocks within a dashboard. Each widget shows a specific metric or trend using:
- A Dataset that defines what data the widget shows
- A Chart that defines how the widget displays it
Example: A widget titled Users with Unused App Access might use the App-to-User Mapping-Flat dataset and display a Bar Chart that plots user names against their last-used date.
See Widgets.
Reports
Reports let you generate and schedule CSV exports of your organization's data, insights, spend, and usage. See Reports.
Updated 18 minutes ago